Download
1 / 6
60 likes | 81 Views
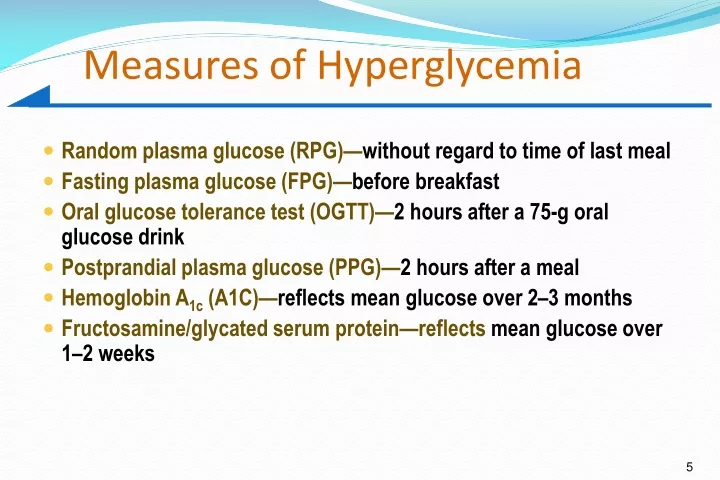
Measures of Hyperglycemia. Random plasma glucose (RPG)— without regard to time of last meal Fasting plasma glucose (FPG)— before breakfast Oral glucose tolerance test (OGTT)— 2 hours after a 75-g oral glucose drink Postprandial plasma glucose (PPG)— 2 hours after a meal

E N D
Measures of Hyperglycemia • Random plasma glucose (RPG)—without regard to time of last meal • Fasting plasma glucose (FPG)—before breakfast • Oral glucose tolerance test (OGTT)—2 hours after a 75-g oral glucose drink • Postprandial plasma glucose (PPG)—2 hours after a meal • Hemoglobin A1c (A1C)—reflects mean glucose over 2–3 months • Fructosamine/glycated serum protein—reflects mean glucose over 1–2 weeks 5
A1C Reflects Both Fasting and Postprandial Hyperglycemia Plasma glucose (mg/dL) 300 Postprandial hyperglycemia 200 Fasting hyperglycemia 100 Normal 0 0600 1200 1800 2400 0600 Time of day Riddle MC. Diabetes Care. 1990;13:676-686 6
Rationale for Diagnostic CriteriaGlycemic Thresholds for Retinopathy Values in Deciles for US Adults Not Known to Have Diabetes NHANES III Prevalence of retinopathy (%) 15 FPG 2-hour postprandial glucose (2-h PPG) A1C 10 5 0 <42 <96 <109 120 <34 <102 <154 195 <3.3 <5.4 <5.9 6.2 FPG (mg/dL) 2-h PPG (mg/dL) A1C (%) 7 American Diabetes Association. Diabetes Care. 2003;26(suppl 1):S5-S20
Glucose Tolerance Categories FPG 2-h PPG (OGTT) Plasma glucose (mg/dL) 240 Diabetes Mellitus 220 200 Diabetes Mellitus 180 IGT 160 140 126 120 IFG Normal 100 Normal 80 60 American Diabetes Association. Diabetes Care. 2004;27(suppl 1):S5-S10 8
IFG and IGTIntermediate Between Normal and Diabetes Impaired Glucose Tolerance (IGT) • 2-h PG on OGTT 140 but 200 mg/dL • Predicts increased risk of diabetes and cardiovascular disease Impaired Fasting Glucose (IFG) • FPG 100 but 126 mg/dL • Predicts increased risk of diabetes and micro- and macrovascular complications 9
Prevalence of Glycemic Abnormalities in the United States US Population: 275 Million in 2000 Undiagnosed diabetes 5.9 million Diagnosed type 1 diabetes ~1.0 million Additional 24.6 million with IGT Diagnosed type 2 diabetes 10 million Centers for Disease Control. Available at: http://www.cdc.gov/diabetes/pubs/estimates.htm; Harris MI. In: National Diabetes Data Group. Diabetes in America. 2nd ed. Bethesda, Md: NIDDK; 1995:15-36; U.S. Census Bureau Statistical Abstract of the U.S.; 2001 10