Download

1 / 23
230 likes | 433 Views
Key Scientific and Impact Results from the IPCC’s Fourth Assessment —And What Has Emerged Since Michael MacCracken, Chief Scientist for Climate Change Programs, Climate Institute,Washington DC. IPCC.

E N D
Key Scientific and Impact Results from the IPCC’s Fourth Assessment—And What Has Emerged SinceMichael MacCracken, Chief Scientistfor Climate Change Programs, Climate Institute,Washington DC
IPCC • Intergovernmental Panel on Climate Change is a scientific body tasked to evaluate the risk of climate change caused by human activity • Established by World Meteorological Organization and United Nations Environment Programme in 1988 • Shared the Nobel Peace Prize with Al Gore in 2007 • Does not do research or monitor climate, instead produces assessment reports based on peer-reviewed, published scientific literature • Comprehensive, objective, open, and transparent • subject to peer-review by scientists & review by governments • Policy neutral • Involves hundreds of scientists from around the world as authors • Reports generally regarded as authoritative • Working groups I, II, III - WG I deals with climate science • Assess changes that have already occurred, predict future climate based on global climate models and emissions scenarios
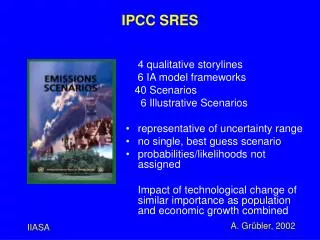
Emissions Scenarios • Special Report on Emissions Scenarios (SRES) released as part of Third Assessment • Emissions scenarios based on projections not by climatologists, but by energy experts, demographers, sociologists, etc. • 40 scenarios grouped into families • A family: more rapid economic growth, more integrated (A1) or divided (A2 world), with more or less reliance on fossil fuel sources • B family: less rapid economic growth, more clean technology, more integrated (B1) or more divided (B2), with more or less reliance on fossil fuels • None of the scenarios include any explicit climate change initiatives (e.g. meeting Kyoto protocol)
Drivers of Climate Change Concentrations of CO2, methane and nitrous oxide have increased markedly as a result of human activities and now far exceed pre-industrial values Net effect of human activities since 1750 has been one of warming
Industrial revolution and the atmosphere The current concentrations of greenhouse gases and their rates of change are unprecedented. Air bubbles in a piece of an ice core
Carbon Dioxide Fossil fuel emissions:1980s: 19.8 GtCO2 /yr1990s: 23.5 GtCO2 /yr2000-2005: 26.4 GtCO2 /yr Land Use Change flux:1980s: 5.1 GtCO2 /yr1990s: 5.9 GtCO2 /yr Atmospheric CO2growth rate:1960 – 2005: 1.4 ppm /yr1995 – 2005: 1.9 ppm /yr Fossil Fuel emissions (in atmospheric concentration units.) Actual CO2 growth Late flash: Atmospheric CO2 concentration is rising at a rate above that of the highest SRES concentration scenario
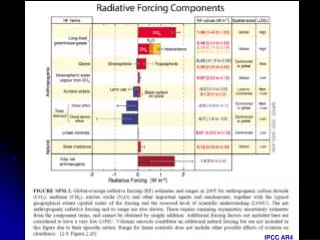
Radiative forcing: change in energy balance Increased by 20% over 1995 - 2005 No best estimate or uncertainty in TAR New estimate less than TAR Total not possible in TAR Used to compare different drivers of climate change W m-2
Radiative forcing: CO2 equivalents CO2-eq of 375 ppmfor net human activities Offset cooling by aerosols is removed within weeks of emission CO2-eq of 455 ppmfor long lived greenhouse gases Used to compare different drivers of climate change
Annual global emissions of CO2 (as C) until recently have been 6-6.5 GtC/yr from fossil fuel combustion and about 1.5 GtC/yr from deforestation • Late flash: Emissions in 2007 were just estimated to be: • ~8.4 GtC/yr (30.8 Gt CO2/yr) from fossil fuel combustion (above the highest scenario projection of IPCC), and • ~1.5 GtC/yr (5.5 Gt CO2/yr) from land-use change Emissions GtC or billions (109) of metric tons of carbon Late flash: No estimate of SO2 emissions, but they must be very large, and likely to increase as C emissions increase, at least for now
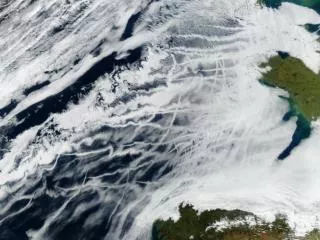
Improved information on aerosols Many more in situ observations, satellite observations, and models for aerosols provide a basis for the first overall estimate of direct and indirect radiative forcing. Difference between model and satellite observations Multi-model mean estimate of aerosol optical depth W m-2 W m-2 Models seem to generally underpredict aerosol loadings over land
Observed Climate Change Warming of the climate systemis unequivocal Numerous long-term changes in climate observed at continental, regional and ocean basin scales Some aspects of climate have not been observed to change much
Global average temperature • However, 1998 still remains the hottest year, with no year since exceeding it. • Might this be an early sign of cooling caused by increasing SO2 emissions and sulfate aerosols?
Warming is truly global Warming trends since 1979 (when satellite measurements started) show: • Warming occurred nearly everywhere at the surface except in eastern Pacific, Southern Ocean and parts of Antarctica; • Land warmed significantly faster than oceans over last 20 years; • Mid-troposphere warming is consistent with that at surface. • There is a 2007 paper by Douglass, Christy, Peterson and Singer asserting that upper tropospheric temperature trends in observations and models do not match. • Santer and others have recently submitted a rebuttal showing good agreement.
Consistent pattern of warming • Surface temperatures increasing • Tropospheric temperatures increasing • Atmospheric water vapour content increasing • Ocean heat content increasing … • … now directly linked to sea level rise • Greenland and Antarctic Ice Sheets losing mass • Glaciers and snow cover decreasing • Arctic sea ice extent decreasing • Area of seasonally frozen ground decreasing • Mid-latitude wind patterns/ storm tracks shifting poleward • More intense and longer droughts • Frequency of heavy precipitation events increasing • Extreme temperatures increasing • Tropical cyclone intensity increasing Unequivocal
Comparisons of observations with model simulations including all forcings (pink) and just natural forcings (blue), for 20th century and providing global and regional coverage The agreement is excellent everywhere except for the ocean during World War II, a period during which observations were difficult IPCC, 2007
Projections of future climate For the next two decades, a warming of about 0.2°C per decade is projected for a range of SRES emission scenarios. Subsequent warming depends on how much greenhouse gases are emitted to the atmosphere from fossil fuel emissions and natural feedbacks from land & oceans.
Projected global average warming Higher emissions lead to more warming later in century. 3.4oC 2.8oC 1.8oC Warming of about 0.2oC per decade for next two decades for a range of scenarios High scenario Medium scenario Low scenario This calculation of the commitment to future warming is likely a factor of 2 low because of the assumption that the aerosol loading would also remain constant! Further warming of ~0.6oC after concentrations stabilized
No one lives at the global average Medium (A1B) scenario (2090-2099): Global mean warming 2.8oC;Much of land area warms by ~3.5oCArctic warms by ~6oC. A 550 ppm CO2-eq world would more likely than not be warmer.
Sea ice extent changes Arctic sea ice extent: 1980 – 2005 trend -2.7% per decade. Summer minimum Arctic sea ice extent trend (not shown) -7.4% per decade. Antarctic sea ice extent:no statistically significant trend Late flash: 2005 was just the beginning of accelerating loss of summer sea ice in the Arctic
The year 2007 set a new record for minimum summer ice extent in the Arctic, far below earlier years Source: National Snow and Ice Data Center http://nsidc.org/ The 2007 minimum extent was only about 4.2 million square kilometers
Models project sharp reductions in Arctic sea ice-but the sea ice is retreating even more rapidly Regional models of sea ice extent are projecting that summer sea ice could be completely gone in a decade or less--far sooner than projected by the global models * ~ -40% Source: Sorteberg, cited by J. Eystein--2005
The wintertime sea ice extent is near the wintertime low of 2006-2007, and well below the long-term average Source: National Snow and Ice Data Center http://nsidc.org/ Shifts in the extent, thickness and timing of sea ice will affect the transfer of heat to the atmosphere and thus perturb atmospheric circulation. With thinning greater in the Eurasian than the Canadian Arctic, it should not be surprising that weather patterns are appearing to be different than they have been. Winter sea ice extent is recovering-- but it is mostly first year ice, not thick