Download
1 / 40
400 likes | 700 Views
The Global Carbon Cycle. Gerrit Lohmann 31. October 2005, 11.15 o‘clock Biogeochemical cycles. S. total flux out of the reservoir. M . content if a substance in the reservoir. Turnover Time, renewal time. single reservoir with source flux Q , sink flux S , and content M. Q. S=kM. M.

E N D
The Global Carbon Cycle Gerrit Lohmann 31. October 2005, 11.15 o‘clock • Biogeochemical cycles
S total flux out of the reservoir M content if a substance in the reservoir Turnover Time, renewal time single reservoir with source flux Q, sink flux S, and content M Q S=kM M The equation describing the rate of change of the content of a reservoir can be written as
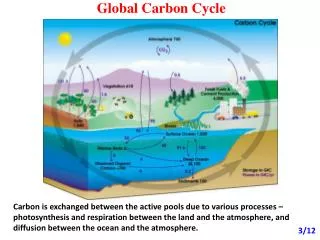
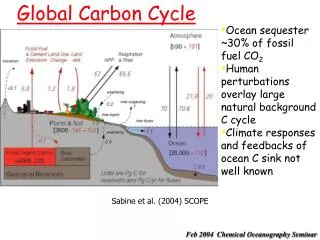
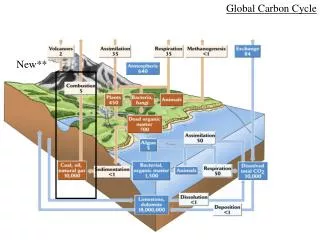
Atmosphere 725 (Annual increase ~3) Deforestation ~1 ~93 ~90 ~60 ~120 ~1 Surface water Dissolved inorg. 700 Dissolved org. 25 (Annual increase ~ 0,3) Short-lived biota ~110 ~15 Long-lived biota ~450 (Annual decrease ~1) ~15 ~40 Detritus decomposition 54-50 Primary production ~40 Respiration & decomposition ~36 Litter ~60 ~40 ~38 Surface biota 3 2 - 5 ‹1 Detritus ~4 2 - 5 Intermediate and Deep water Dissolved inorg. 36,700 Dissolved org. 975 (Annual increase ~ 2,5) Soil 1300 - 1400 (Annual decrease ~1) Peat (Torf) ~160 ‹1 5 Fossil fuels oil, coal, gas 5,000 - 10,000 Land Sea Fig. 4-3 principal reservoirs and fluxes in the carbon cycle. Units are 1015 g(Pg) C (burdens) and PgC/yr (fluxes). (From Bolin (1986) with permission from John Wiley and Sons.)
The adjustment process is e-folding time
The flux Fij from reservoir i to reservoir j is given by The rate of change of the amount Mi in reservoir i is thus where n is the total number of reservoirs in the system. This system of differential equations can be written in matrix form as Master Equation, Statistical Physics where the vector M is equal to (M1, M2,... Mn) and the elements of matrix k are linear combinations of the coefficients kij
response time turnover times of the two reservoirs
Simplified model of the carbon cycle. Ms represents the sum of all forms of dissolved carbon , , and F AT Terrestrial System M T Atmosphere M A F TA F SA F AS Ocean surface Diss C= CO2,HCO3,H2CO3 M S F DS F SD Deep layers of ocean M D Non-linear System: Simplified model of the biogeochemical carbon cycle. (Adapted from Rodhe and Björkström (1979) with the permission of the Swedish Geophysical Society.)
Inorganic Carbon Cycle Basic concepts, non-linearity in the oceanic carbon system hydrated Carbonate acid Bicarbonate carbonate Free proton
Equilibrium relationships between these species: pCO2:Partial pressure atm. [ ]:Concentrations/activities
Simplified model of the carbon cycle. Ms represents the sum of all forms of dissolved carbon , , and F AT Terrestrial System M T Atmosphere M A F TA Exponent = 10 Buffer factor Revelle factor Degassing Dissolution F SA F AS Ocean surface Diss C= CO2,HCO3,H2CO3 M S F DS F SD Deep layers of ocean M D The buffer factor results from the equilibrium between CO2(g) and the more prevalent forms of dissolved carbon. As a consequence of this strong dependence of FSA on MS, a substantial increase in CO2 in the atmosphere is balanced by a small increase of MS.
Simplified model of the carbon cycle. Ms represents the sum of all forms of dissolved carbon , , and F AT Atmosphere to the terrestial system Terrestrial System M T Atmosphere M A F TA Degassing Dissolution F SA F AS Ocean surface Diss C= CO2,HCO3,H2CO3 M S F DS F SD Deep layers of ocean M D
Equilibrium relationships between these species: pCO2:Partial pressure atm. [ ]:Concentrations/activities 3 Equations and 5 unknowns! Specify 2 of the unknowns pH= - log10 [H+]
pCO2 change with temperature etc.; kept as variable Introduce new variables which are measured: Dissolved inorganic carbon Total alkalinity: measure of excess of bases over acids Borate ion 4 new unknowns, 2 more equations
Additional contrains: 3 Equations & 1 new unknown The total boron concentration is nearly constant within the ocean:
log log log log
Global mean seawater properties Approximations:
What controls the pCO2 ? Sensitivity of pCO2 to changes in DIC and Alk
What controls the pCO2 ? Sensitivity of pCO2 to changes in DIC ans Alk ca. 10 ca. -10
Fig. 8.1.2: Horizontally averaged profiles of salinity normalized DIC and Alk in the global oceans. Based on the gridded climatological data from the GLODAP project (R. M. Key, personal communication).
What controls the pCO2 ? Sensitivity of pCO2 to changes in DIC and Alk ca. 10 ca. -10 pCO2 increase by 10% when DIC is increased by 1% pCO2 decrease by 10% when Alk is increased by 1%
What controls the pCO2 ? Sensitivity of pCO2 to changes in DIC and Alk ca. 10 ca. -10 pCO2 = c DIC10
Simplified model of the carbon cycle. Ms represents the sum of all forms of dissolved carbon , , and F AT Terrestrial System M T Atmosphere M A F TA Exponent = 10 Buffer factor Revelle factor Degassing Dissolution F SA F AS Ocean surface Diss C= CO2,HCO3,H2CO3 M S F DS F SD Deep layers of ocean M D F=k (pCO2 atm – pCO2 sol) = k (pCO2 atm – c DIC10) The buffer factor results from the equilibrium between CO2(g) and the more prevalent forms of dissolved carbon. As a consequence of this strong dependence of FSA on MS, a substantial increase in CO2 in the atmosphere is balanced by a small increase of MS.
EQUATIONS FOR MODEL OF SIMPLE OCEAN - ATMOSPHERE CARBON CYCLE • Reservoirs: • INIT Atmosphere = 600 {Gt C} • INIT Surface_Ocean = 891.62591 {Gt C} • INIT Deep_Ocean = 38000 {Gt C} • Flows: • external_additions = 0 {volcanic emissions or fossil fuel burning, etc.} • oc--atm_exchange = k_ao*(pCO2_atm-pCO2_Ocean) • bio_pump = 10 • ocean_turnover = 100*(Deep_Ocean/INIT(Deep_Ocean))-90.6*(Surface_Ocean/INIT(Surface_Ocean)) {this is upwelling minus downwelling} • burial = 0.6*(bio_pump/10) • runoff = 0.6 • Converters: • Alk_Surf = 2.22 {slightly modified from Walker, 1993} • CO3 = (Alk_Surf-HCO3)/2 {following Walker, 1993} • HCO3 = (Surf_C_conc-SQRT(Surf_C_conc^2-Alk_Surf*(2*Surf_C_conc-Alk_Surf)*(1-4*Kcarb)))/(1- 4*Kcarb) {following Walker, 1993} • Kcarb = .000575+.000006*(T_surf-278) {following Walker, 1993} • KCO2 = .035+.0019*(T_surf-278) {following Walker, 1993} • k_ao = .278 {Gt C/yr/ppm -- the observationally-derived rate constant; this is for the entire surface area of the ocean} • pCO2_atm = Atmosphere*(280/600) • pCO2_Ocean = 280*KCO2*(HCO3^2/CO3) {following Walker, 1993} • Surf_C_conc = (Surface_Ocean/12000)/Vol_surf {1e18 moles/m^3} • T_surf = 288 {°K following Walker, 1993}} • Vol_surf = .0363 {units are 1E18 m^3 -- this is the upper 100 m} • del_atm = (Atmosphere-600)-(DELAY(Atmosphere,1)-600) • del_deep_ocean = (Deep_Ocean-INIT(Deep_Ocean))-(DELAY(Deep_Ocean, 1)-INIT(Deep_Ocean)) • del_surf_ocean = (Surface_Ocean-INIT(Surface_Ocean))-(DELAY(Surface_Ocean, 1)- INIT(Surface_Ocean)) • http://www.acad.carleton.edu/curricular/GEOL/DaveSTELLA/Carbon/c_cycle_models.htm
EQUATIONS FOR MODEL OF SIMPLE TERRESTRIAL CARBON CYCLE • RESERVOIRS: • INIT Atmosphere = 600 {Gt C -- 1 Gt=1e15 g -- from IPCC, 1995} • INIT Land_Biota = 610 { Gt C -- 1 Gt=1e15 g -- from IPCC, 1995} • INIT Soil = 1580 { Gt C -- 1 Gt=1e15 g -- from IPCC, 1995} • FLOWS: (all in Gt C/yr) • Soil_Respiration = (49.4/INIT(Soil))*Soil*(1+(Tsens_sr*global_temp)) {initial value from Siegenthaler and Sarmiento, 1993} • Plant_Respiration = Photosynthesis*(50/100) {equation modified from Gifford, 1993; initial value from Siegenthaler and Sarmiento, 1993} • External_addition = 0.6 {volcanic emissions or fossil fuel burning, etc.} } • Photosynthesis = (Pmax*(pCO2_eff/(pCO2_eff+Khs)))*(1+(Tsens_p*global_temp)) {equation modified from Gifford, initial value from S&S} • Litter_fall = 50*(Land_Biota/610) {modified from Gifford, 1993 initial value from S&S} • Runoff = .6*Soil/INIT(Soil) {value from S&S} • CONVERTERS: • Khs = 62.5 {ppm CO2; this is the half-saturation value -- the level of atmospheric C at which the rate of photosynthesis is half of the ultimate saturation value, given that particular temperature; modified from Gifford, 1993} • Pmax = ((Khs+250)*100)/250 {Gt C/yr; this is the maximum rate of photosynthesis possible at the saturation level of CO2, ignoring the temperature effect -- from Gifford, 1993} • global_temp = (pCO2_atm-280)*.01 {°C relative to today's temp of 15; from K&S, 1994} • pCO2_atm = Atmosphere*(280/600) {ppm} • pCO2_min = 30 {ppm -- no photosynthesis can occur below this level; from Gifford, 1993} • pCO2_eff = pCO2_atm-pCO2_min {ppm; the effective atmospheric CO2 concentration} • Tsens_p = .04 {°C-1; temperature sensitivity factor for photosynthesis; after Gifford} • Tsens_sr = .10 {°C-1; temperature sensitivity factor for soil respiration; after Gifford} • Atmos_Change = Atmosphere-600 { Gt C; change in atmospheric carbon -- used to compare results of various experiments} • Land_Biota_Change = Land_Biota-610 {Gt C} • Soil_Change = Soil-1580 {Gt C} • Total_Change = Atmos_Change+Land_Biota_Change+Soil_Change {Gt C} • http://www.acad.carleton.edu/curricular/GEOL/DaveSTELLA/Carbon/c_cycle_models.htm#eqns3
Fig. 8.1.1: Map of the annual mean air-sea difference of the partial pressure of CO2. Based on data from Takahashi et al. (2002).
CO2 atm. const. -> delta is driven by the oceans • Temp., salinity, DIC, Alk
Atmosphere 725 (Annual increase ~3) Deforestation ~1 ~93 ~90 ~60 ~120 ~1 Surface water Dissolved inorg. 700 Dissolved org. 25 (Annual increase ~ 0,3) Short-lived biota ~110 ~15 Long-lived biota ~450 (Annual decrease ~1) ~15 ~40 Detritus decomposition 54-50 Primary production ~40 Respiration & decomposition ~36 Litter ~60 ~40 ~38 Surface biota 3 2 - 5 ‹1 Detritus ~4 2 - 5 Intermediate and Deep water Dissolved inorg. 36,700 Dissolved org. 975 (Annual increase ~ 2,5) Soil 1300 - 1400 (Annual decrease ~1) Peat (Torf) ~160 ‹1 5 Fossil fuels oil, coal, gas 5,000 - 10,000 Land Sea Fig. 4-3 principal reservoirs and fluxes in the carbon cycle. Units are 1015 g(Pg) C (burdens) and PgC/yr (fluxes). (From Bolin (1986) with permission from John Wiley and Sons.)
http://www.acad.carleton.edu/curricular/GEOL/DaveSTELLA/Carbon/c_cycle_models.htmhttp://www.acad.carleton.edu/curricular/GEOL/DaveSTELLA/Carbon/c_cycle_models.htm • http://cran.r-project.org/src/contrib/Descriptions/longmemo.html