Download
1 / 11
110 likes | 233 Views
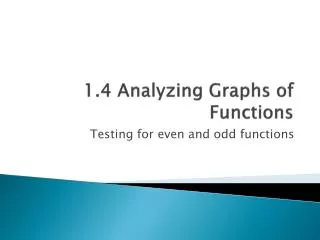
Analyzing Graphs of Polynomials. Section 3.2. First a little review…. Given the polynomial function of the form: f(x) = a n x n + a n−1 x n−1 + . . . + a 1 x + a 0 If k is a zero, Zero: __________ Solution: _________ Factor: _________

E N D
Analyzing Graphs of Polynomials Section 3.2
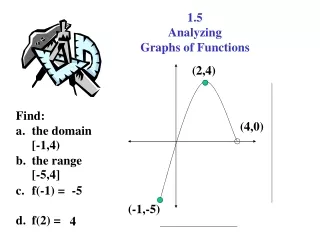
First a little review… Given the polynomial function of the form: f(x) = anxn + an−1xn−1 + . . . + a1x + a0 If k is a zero, Zero: __________ Solution: _________ Factor: _________ If k is a real number, then k is also a(n) __________________. x = k x = k (x – k) x - intercept
Sharp corner – must not be a polynomial function Hole Break What kind of curve? All polynomials have graphs that are smooth continuous curves. A smooth curve is a curve that does not have sharp corners. A continuous curve is a curve that does not have a break or hole.
y y y y x x x x , f(x) , f(x) , f(x) , f(x) , f(x) , f(x) , f(x) , f(x) As x - As x + As x + As x + As x - As x - As x + As x - End Behavior An < 0 , Even Degree An > 0 , Odd Degree An > 0 , Odd Degree An < 0 , Odd Degree An > 0 , Even Degree
Relative maximum The graph “turns” Relative minimums The graph “turns” What happens in the middle? ** This graph is said to have 3turning points. ** The turning points happen when the graph changes direction. This happens at the vertices. ** Vertices are minimums and maximums. ** The lowest degree of a polynomial is (# turning points + 1). So, the lowest degree of this polynomial is 4 !
The lowest degree of this polynomial is The leading coefficient is , f(x) , f(x) As x - As x + What’s happening? Relative Maximums Also called Local Maxes Relative Minimums Also called Local Mins click 5 click positive
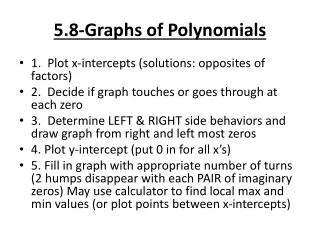
Negative-odd polynomial of degree 3 , f(x) As x - , f(x) As x + Graphing by hand Step 1: Plot the x-intercepts Step 2: End Behavior? Number of Turning Points? Step 3: Plot points in between the x-intercepts. Example #1: Graph the function: f(x) = -(x + 4)(x + 2)(x - 3) and identify the following. End Behavior: _________________________ # Turning Points: _______________________ Lowest Degree of polynomial: ______________ 2 3 2 Try some points in the middle. (-3, -6), (-1, 12), (1, 30), (2, 24) You can check on your calculator! X-intercepts
Positive-even polynomial of degree 4 Relative max Relative minimum Absolute minimum , f(x) As x - , f(x) As x + Graphing with a calculator Example #2: Graph the function: f(x) = x4 – 4x3 – x2 + 12x – 2 and identify the following. End Behavior: _________________________ # Turning Points: _______________________ Degree of polynomial: ______________ 3 4 Plug equation into y= Real Zeros
Positive-odd polynomial of degree 3 , f(x) As x - , f(x) As x + Graphing without a calculator Example #3: Graph the function: f(x) = x3 + 3x2 – 4x and identify the following. End Behavior: _________________________ # Turning Points: _______________________ Degree of polynomial: ______________ 2 3 1. Factor and solve equation to find x-intercepts 2. Try some points in the around the Real Zeros Where are the maximums and minimums? (Check on your calculator!)
P(b) is positive. (The y-value is positive.) a b P(a) is negative. (The y-value is negative.) Therefore, there must be at least one real zero in between a & b! Zero Location Theorem Given a function, P(x) and a & b are real numbers. If P(a) and P(b) have opposite signs, then there is at least one real zero (x-intercept) in between x = a & b.
Even & Odd Powers of (x – c) The exponent of the factor tells if that zero crosses over the x-axis or is a vertex. If the exponent of the factor is ODD, then the graph CROSSES the x-axis. If the exponent of the factor is EVEN, then the zero is a VERTEX. Try it. Graph y = (x + 3)(x – 4)2 Try it. Graph y = (x + 6)4 (x + 3)3