Download
1 / 18
180 likes | 274 Views
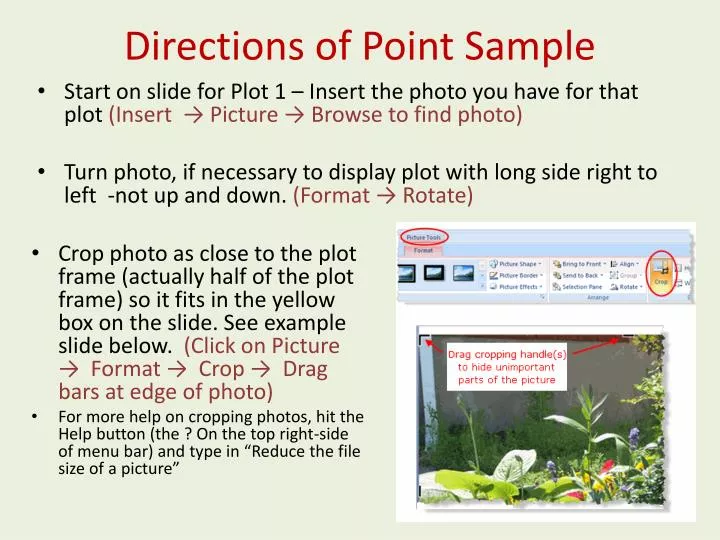
Directions of Point Sample. Start on slide for Plot 1 – Insert the photo you have for that plot (Insert → Picture → Browse to find photo) Turn photo, if necessary to display plot with long side right to left -not up and down. (Format → Rotate).

E N D
Directions of Point Sample • Start on slide for Plot 1 – Insert the photo you have for that plot (Insert → Picture → Browse to find photo) • Turn photo, if necessary to display plot with long side right to left -not up and down. (Format → Rotate) • Crop photo as close to the plot frame (actually half of the plot frame) so it fits in the yellow box on the slide. See example slide below. (Click on Picture → Format → Crop → Drag bars at edge of photo) • For more help on cropping photos, hit the Help button (the ? On the top right-side of menu bar) and type in “Reduce the file size of a picture”
Directions of Point Sample • Once picture is set into the yellow box, send it to the back. Right click on photo and select “Send To Back” • Enter a tally on a data sheet such as this one here to describe cover at each point on each slide. • There are 10 points on each plot slide, there are 15 plots, so you should have 150 points to use to calculate % cover of each category
Example Plot 10 1 4 9 2 3 7 6 5 8 This is what it will look like in the end.
Plot 1 –ENTER PICTURE of PLOT 1 IN THE BOX 10 1 4 9 2 3 7 6 5 8
Plot 2 10 1 4 9 2 3 7 6 5 8
Plot 3 10 1 4 9 2 3 7 6 5 8
Plot 4 10 1 4 9 2 3 7 6 5 8
Plot 5 10 1 4 9 2 3 7 6 5 8
Plot 6 10 1 4 9 2 3 7 6 5 8
Plot 7 10 1 4 9 2 3 7 6 5 8
Plot 8 10 1 4 9 2 3 7 6 5 8
Plot 9 10 1 4 9 2 3 7 6 5 8
Plot 10 10 1 4 9 2 3 7 6 5 8
Plot 11 10 1 4 9 2 3 7 6 5 8
Plot 12 10 1 4 9 2 3 7 6 5 8
Plot 13 10 1 4 9 2 3 7 6 5 8
Plot 14 10 1 4 9 2 3 7 6 5 8
Plot 15 10 1 4 9 2 3 7 6 5 8