Download

1 / 54
540 likes | 725 Views
Tactical Asset Allocation 2 session 6. Andrei Simonov. Agenda. Statistical properties of volatility. Persistence Clustering Fat tails Is covariance matrix constant? Predictive methodologies Macroecon variables Modelling volatility process: GARCH process and related methodologies Volume

E N D
Tactical Asset Allocation 2session 6 Andrei Simonov Tactical Asset Allocation
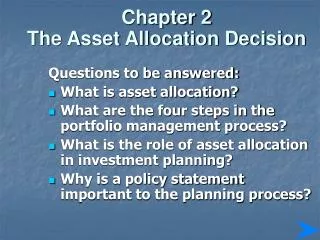
Agenda • Statistical properties of volatility. • Persistence • Clustering • Fat tails • Is covariance matrix constant? • Predictive methodologies • Macroecon variables • Modelling volatility process: GARCH process and related methodologies • Volume • Chaos • Skewness Tactical Asset Allocation
Volatility is persistent • Returns2 are MORE autocorrelated than returns themselves. Volatility is indeed persistent. Akgiray, JB89 Tactical Asset Allocation
It is persistent for different holding periods and asset classes Sources: Hsien JBES(1989), Taylor&Poon, JFB92 Tactical Asset Allocation
Volatility Clustering, rt=ln(St/St-1). Tactical Asset Allocation
Volatility clustering Tactical Asset Allocation
Kurtosis & Normal distribution • Kurtosis=0 for normal dist. If it is positive, there are so-called FAT TAILS Tactical Asset Allocation
Higher Moments & Expected Returns Data through June 2002 Tactical Asset Allocation
Higher Moments & Expected Returns Data through June 2002 Tactical Asset Allocation
Extreme events Tactical Asset Allocation
Normal distribution: • Only 1 observation in 15800 should be outside of 4 standard deviations band from the mean. • Historicaly observed: • 1 in 293 for stock returns (S&P) • 1 in 138 for metals • 1 in 156 for agricultural futures Tactical Asset Allocation
What do we know about returns? • Returns are NOT predictable (martingale property) • Absolute value of returns and squared returns are strongly serially correlated and not iid. • Kurtosis>0, thus,returns are not normally distributed and have fat tails • -’ve skewness is observed for asset returns Tactical Asset Allocation
ARCH(1) • volatility at time t is a function of volatility at time t-1 and the square of of the unexpected change of security price at t-1. Ret(t)=f Ret(t-1)+et e(t)= s(t) z(t) s2(t)=a0+a1e2(t-1), z~N(0, 1) • If volatility at t is high(low), volatility at t+1 will be high(low) as well • Greater a1 corresponds to more persistency Tactical Asset Allocation
Simulating ARCH vs Normal ARCH(4) ARCH(1) Normal Tactical Asset Allocation
GARCH=Generalized Autoregressive Heteroskedasticity • volatility at time t is a function of volatility at time t-1 and the square of of the unexpected change of security price at t-1. s2(t)=a0+b1s2(t-1)+ a1e2(t-1), e~N(0, s2t) • If volatility at t is high(low), volatility at t+1 will be high(low) as well • The greater b, the more gradual the fluctuations of volatility are over time • Greater a1 corresponds to more rapid changes in volatility Tactical Asset Allocation
Persistence • If (a1+b)>1, then the shock is persistent (i.e., they accumulate). • If (a1+b)<1, then the shock is transitory and will decay over time • For S&P500 (a1+b)=0.841, then in 1 month only 0.8414=0.5 of volatility shock will remain, in 6 month only 0.01 will remain • Those estimates went down from 1980-es (in 1988 Chow estimated (a1+b)=0.986 Tactical Asset Allocation
Forecasting power • GARCH forecast is far better then other forecasts • Difference is larger over high volatility periods • Still, all forecasts are not very precise (MAPE>30%) • xGARCH industry Tactical Asset Allocation
Options’ implied volatilities • Are option implicit volatilities informative onfuture realized volatilities? YES • If so, are they an unbiased estimate of futurevolatilities? NO • Can they be beaten by statistical models ofvolatility behavior (such as GARCH)? I.e. doesone provide information on top of theinformationprovided by the other? • Lamoureux and Lastrapes: ht= w + ae2t-1 + bh t-1+ gsimplied • They find gsignificant. Tactical Asset Allocation
Which method is better?(credit due: Poon & Granger, JEL 2003) Tactical Asset Allocation
Straddles: a way to trade on volatility forecast Profit • Straddles delivers profit if stock price is moving outside the normal range • If model predicts higher volatility, buy straddle. • If model predicts lower volatility, sell straddle X ST Tactical Asset Allocation
Volatility and Trade • Lamoureux and Lastrapes: Putting volume in the GARCH equiation, makes ARCH effects disappear. ht= w + ae2t-1 + bh t-1+ gVolume • Heteroscedastisity is (at least, partially) due to the information arrival and incorporation of this information into prices. • Processing of information matters! Tactical Asset Allocation
What else matters? Macroeconomy Tactical Asset Allocation
Macroeconomic variables (2) Tactical Asset Allocation
Stock returns and the business cycle:VolatilityNBER Expansions and ContractionsJanuary 1970-March 1997 Tactical Asset Allocation
Predicting Correlations (1) • Crucial for VaR • Crucial for Portfolio Management • Stock markets crash together in 87 (Roll) and again in 98... • Correlations varies widely with time, thus, opportunities for diversification (Harvey et al., FAJ 94) Tactical Asset Allocation
Predicting Correlations (2) • Use “usual suspects” to predict correlations • Simple approach “up-up” vs. “down-down” Tactical Asset Allocation
Predicting Correlations (3) Tactical Asset Allocation
Chaos as alternative to stochastic modeling • Chaos in deterministic non-linear dynamic system that can produce random-looking results • Feedback systems, x(t)=f(x(t-1), x(t-2)...) • Critical levels: if x(t) exceeds x0, the system can start behaving differently (line 1929, 1987, 1989, etc.) • The attractiveness of chaotic dynamics is in its ability to generate large movements which appear to be random with greater frequency than linear models (Noah effect) • Long memory of the process (Joseph effect) Tactical Asset Allocation
Example: logistic eq. • X(t+1)=4ax(t)(1-x(t)) Tactical Asset Allocation
A=0.9 A=0.95 Tactical Asset Allocation
Hurst Exponent • Var(X(t)-X(0)) t2H • H=1/2 corresponds to “normal” Brownian motion • H<(>)1/2 – indicates negative (positive) correlations of increments • For financial markets (Jan 63-Dec89, monthly returns): IBM 0.72 Coca-Cola 0.70 Texas State Utility 0.54 S&P500 0.78 MSCI UK 0.68 Japanese Yen 0.64 UK £ 0.50 Tactical Asset Allocation
Long Memory • Memory cannot last forever. Length of memory is finite. • For financial markets (Jan 63-Dec89, monthly returns): IBM 18 month Coca-Cola 42 Texas State Utility 90 S&P500 48 MSCI UK 30 • Industries with high level of innovation have short cycle (but high H) • “Boring” industries have long cycle (but H close to 0.5) • Cycle length matches the one for US industrial production • Most of predictions of chaos models can be generated by stochastic models. It is econometrically impossible to distinguish between the two. Tactical Asset Allocation
Correlations and Volatility: • Predictable. • Important in asset management • Can be used in building dynamic trading strategy (“vol trading”) • Correlation forecasting is of somewhat limited importance in “classical TAA”, difference with static returns is rather small. • Pecking order: expected returns, volatility, everything else… • Good model: EGARCH with a lot of dummies Tactical Asset Allocation
Smile please!Black- Scholes implied volatilities (01.04.92) Tactical Asset Allocation
Skewness & Expected Returns Data through June 2002 Tactical Asset Allocation
Skewness & Expected Returns Data through June 2002 Tactical Asset Allocation
Skewness or ”crash” premia (1) • Skewness premium =Price of calls at strike 4% above forward price/ price of puts at strike 4% below forward price- 1 • The two diagrams following show: • That fears of crash exist mostly since the 1987 crash • This shows also in the volume of transactions onputs compared to calls Tactical Asset Allocation
Skewness or ”crash” premia (2) Tactical Asset Allocation
Skewness See also movie from Cam Harvey web site. Tactical Asset Allocation
Where skewness is coming from? • Log-normal distribution • Behavioral preferences (non-equivalence between gains and losses) • Experiments: People like +’ve skewness and hate negative skewness. Tactical Asset Allocation
Conditional Skewness, Bakshi, Harvey and Siddique (2002) Tactical Asset Allocation
What can explain skewness? • Stein-Hong-Chen: imperfections of the market cause delays in incorporation of the information into prices. • Measure of info flows – turnover or volume. Tactical Asset Allocation
Co-skewness • Describe the probability of the assets to run-up or crash together. • Examples: ”Asian flu” of 98,” crashes in Eastern Europe after Russian Default. • Can be partially explained by the flows. • Important: Try to avoid assets with +’ve co-skewness. Especially important for hedge funds • Difficult to measure. Tactical Asset Allocation
Three-Dimensional Analysis Tactical Asset Allocation
Alternative Vehicles Alternate Asset Classes Often Involve Implicit or Explicit Options Source: Naik (2002) Tactical Asset Allocation
Alternative Vehicles Alternate Asset Classes Often Involve Implicit or Explicit Options Source: Naik (2002) Tactical Asset Allocation
Alternative Vehicles Alternate Asset Classes Often Involve Implicit or Explicit Options Source: Naik (2002) Tactical Asset Allocation