Download
1 / 47
480 likes | 491 Views
Chapter 9 Nuclear Magnetic Resonance and Mass Spectrometry: Tools for Structure Determination. Introduction Spectroscopy: the study of the interaction of energy with matter Energy applied to matter can be absorbed, emitted, cause a chemical change, or be transmitted

E N D
Chapter 9Nuclear Magnetic Resonance and Mass Spectrometry:Tools for Structure Determination
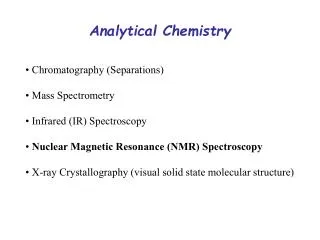
Introduction • Spectroscopy: the study of the interaction of energy with matter • Energy applied to matter can be absorbed, emitted, cause a chemical change, or be transmitted • Spectroscopy can be used to elucidate the structure of a molecule • Examples of Spectroscopy • Infrared (IR) Spectroscopy (Chapter 2) • Infrared energy causes bonds to stretch and bend • IR is useful for identifying functional groups in a molecule • Nuclear Magnetic Resonance (NMR) • Energy applied in the presence of a strong magnetic field causes absorption by the nuclei of some elements (most importantly, hydrogen and carbon nuclei) • NMR is used to identify connectivity of atoms in a molecule • Mass Spectrometry (MS) • Molecules are converted to ions by one of several methods (including bombardment by a beam of electrons) • The ions formed may remain intact (as molecular ions, M+), or they may fragment • The resulting mixture of ions is sorted by mass/charge (m/z) ratio, and detected • Molecular weight and chemical formula may be derived from the M+ and M+1 ions • Molecular structure may be deduced from the distribution of fragment ions Chapter 9
The Electromagnetic Spectrum • Electromagnetic radiation has the characteristics of both waves and particles • The wave nature of electromagnetic radiation is described by wavelength (l) or frequency (n) • The relationship between wavelength (or frequency) and energy (E) is well defined • Wavelength and frequency are inversely proportional (n= c/l) • The higher the frequency, the greater the energy of the wave • The shorter the wavelength, the greater the energy of the wave Chapter 9
NMR involves absorption of energy in the radiofrequency range Chapter 9
Nuclear Magnetic Resonance (NMR) Spectroscopy • The nuclei of protons (1H) and carbon-13 (13C), and certain other elements and isotopes, behave as if they were tiny bar magnets • When placed in a magnetic field and irradiated with radio frequency energy, these nuclei absorb energy at frequencies based on their chemical environments • NMR spectrometers are used to measure these absorptions • Continuous-Wave (CW) NMR Spectrometers • The oldest type of NMR spectrometer • The magnetic field is varied as the electromagnetic radiation is kept at a constant frequency • Different nuclei absorb the electromagnetic energy based on their chemical environment and produce peaks in different regions of the spectrum Chapter 9
Fourier Transform (FT) NMR Spectrometers • The sample is placed in a constant (and usually very strong) magnetic field • The sample is irradiated with a short pulse of radio frequency energy that excites nuclei in different environments all at once • The resulting signal contains information about all of the absorbing nuclei at once • This signal is converted to a spectrum by a Fourier transformation • FT NMR allows signal-averaging, which leads to enhancement of real spectral signals versus noise • The strong, superconducting magnets used in FTNMR spectrometers lead to greater sensitivity and much higher resolution than continuous wave instruments Chapter 9
Chemical Shift: Peak Position in an NMR Spectrum • Nuclei in different chemical environments in a molecule will absorb at slightly different frequencies • The position of the signals in the spectrum is called the “chemical shift” • There are two reasons for differences in the magnetic environment for a proton • The magnetic field generated by electrons circulating around the nucleus giving the signal • Local magnetic fields generated by electrons elsewhere in the molecule Chapter 9
Example: 1,4-dimethylbenzene • The spectrum is measured on a delta (d) scale in units of parts per million (ppm) • Lower frequency is to the left in the spectrum; these absorptions are said to be downfield • Higher frequency is to the right in the spectrum: these absorptions are said to be upfield • The small signal at d 0 corresponds to an internal standard called tetramethylsilane (TMS) used to calibrate the chemical shift scale • The number of signals in the spectrum corresponds to the number of unique sets of protons • 1,4-dimethylbenzene has protons in two unique environments and so shows two signals Chapter 9
Integration of Peak Areas. The Integral Curve • The area under each signal corresponds to the relative number of hydrogen atoms in each unique environment within a molecule • The height of each step in the integral curve is proportional to the area of the signal underneath the step • Signal Splitting • The signal from a given proton will be split by the effect of magnetic fields associated with protons on adjacent carbons • Characteristic peak patterns result from signal splitting that are related to the number of protons on adjacent carbons • Example: 1,1,2-trichloroethane Chapter 9
Nuclear Spin: The Origin of the Signal • The nuclei of certain elements and isotopes have spin states that are quantized • 1H has a spin quantum number I = 1/2 and has allowed spin states of +1/2 or -1/2 • Other nuclei with I = 1/2 are 13C, 19F and 31P and these also respond to an external magnetic field • Nuclei with I = 0 do not have spin (12C and 16O) and do not respond to an external magnetic field • The nucleiof NMR-active nuclei behave like tiny bar magnets • In the absence of an external magnetic field these bar magnets are randomly orientated • In an external magnetic field they orient either with (a spin state) or against (b spin state) the magnetic field Chapter 9
Nuclei aligned with the magnetic field are lower in energy than those aligned against the field • The nuclei aligned with the magnetic field can be flipped to align against it if the right amount of energy is added (DE) • The amount of energy required depends on the strength of the external magnetic field • The stronger the external magnetic field, the higher the radio frequency energy required to flip the nuclear spin • At (a) there is no external magnetic field and therefore no energy difference between the two states • At (b) the external magnetic field is 1.41 Tesla and energy corresponding to a frequency of about 60MHz is needed to flip between the spin states • At (c) the external magnetic field is 7.04 Tesla energy corresponding to a frequency of about 300MHz is needed to flip between the spin states Chapter 9
Shielding and Deshielding of Protons • Protons in an external magnetic field absorb at different frequencies depending on the electron density around that proton • High electron density around a nucleus shields the nucleus from the external magnetic field • Shielding causes absorption of energy at higher frequencies (more energy is required for this nucleus to flip between spin states) - the signals are upfield in the NMR spectrum • Lower electron density around a nucleus deshields the nucleus from the external magnetic field • Deshielding causes absorption of energy at lower frequencies (less energy is required for this nucleus to flip between spin states) - the signals are downfield in the NMR spectrum Chapter 9
Electronegative atoms draw electron density away from nearby protons and therefore deshield them • Circulation of p electrons leads to a local induced magnetic field • The induced field can reinforce or diminish the external field sensed by a proton (depending on the location of the proton), causing deshielding or shielding, respectively • Alkene and aromatic ring hydrogens are deshielded by the circulation of p electrons. • A terminal alkyne hydrogen is shielded by the circulation of p electrons. Chapter 9
Chemical Shift • Chemical shifts are measured in relation to the internal reference tetramethylsilane (TMS) • The protons of TMS are highly shielded because of the strong electron donating capability of silicon • The signal for TMS is well away from most other proton absorptions • The d scale for chemical shifts is independent of the magnetic field strength of the instrument (whereas the absolute frequency depends on field strength) • Thus, the chemical shift in d units for protons on benzene is the same whether a 60 MHz or 300 MHz instrument is used Chapter 9
Chemical Shift Equivalent and Nonequivalent Protons • To predict the number of signals to expect in an NMR spectrum it is necessary to determine how many sets of protons are in unique environments • Chemically equivalent protons are in the same environment and will produce only one signal • Homotopic Hydrogens • Hydrogens are chemically equivalent or homotopic if replacing each one in turn by the same group would lead to an identical compound Chapter 9
Enantiotopic and Diastereotopic Hydrogen Atoms • If replacement of each of two hydrogens by some group leads to enantiomers, those hydrogens are enantiotopic • In the absence of a chiral influence, enantiotopic hydrogens have the same chemical shift and appear in the same signal • If replacement of each of two hydrogens by some group leads to diastereomers, the hydrogens are diastereotopic • Diastereotopic hydrogens have different chemical shifts and will give different signals Chapter 9
Signal Splitting: Spin-Spin Coupling • The signal from a given proton will be split by the effect of magnetic fields associated with protons on adjacent carbons • Characteristic peak patterns result from signal splitting that are related to the number of protons on adjacent carbons • The effect of signal splitting is greatest between atoms separated by 3 or fewer s bonds • Signal splitting is not observed between homotopic or enantiotopic protons • Signal splitting occurs only when two sets of protons have different chemical shifts (i.e., are not chemical shift equivalent) Chapter 9
The magnetic field sensed by a proton (Ha) being observed is affected by the magnetic moment of an adjacent proton (Hb) • A proton (Hb) can be aligned with the magnetic field or against the magnetic field, resulting in two energy states for Hb • The observed proton (Ha) senses the two different magnetic moments of Hb as a slight change in the magnetic field; one magnetic moment reinforces the external field and one substracts from it • The signal for Ha is split into a doublet with a 1:1 ratio of peak areas • The magnitude of the splitting is called the coupling constant Jab and is measured in Hertz (Hz) Chapter 9
When two adjacent protons Hb are coupled to Ha, there are four possible combinations of the magnetic moments for the two Hbs • Two of these combinations involve pairings of magnetic moments that cancel each other, causing no net displacement of signal • One combination of magnetic moments reinforces and another subtracts from the applied magnetic field • Ha is split into a triplet having a 1:2:1 ratio of signal areas Chapter 9
When three adjacent protons are coupled to Ha, there are 10 possible combinations of the magnetic moments for the Hbs • Four unique orientations exist and so Ha is split into a quartet with intensities 1:4:4:1 Chapter 9
The general rule for splitting is that if there are n equivalent protons on adjacent atoms, these will split a signal into n + 1 peaks • Coupled peaks have the same coupling constants J • Comparison of coupling constants can help with the analysis of complex spectra • Several factors complicate analysis of NMR spectra • Peaks may overlap • Spin-spin coupling can be long-range (i.e., more than 3 bonds) • Splitting patterns in aromatic groups can be confusing • A monosubstituted aromatic ring can appear as an apparent singlet or a complex pattern of peaks Chapter 9
Much more complex splitting can occur when two sets of adjacent protons split a particular set of protons • In the system below, Hb is split by two different sets of hydrogens : Ha and Hc • Theortically Hb could be split into a triplet of quartets (12 peaks) but this complexity is rarely seen • The spectrum of 1-nitropropane shows splitting of Hb into only 6 peaks Chapter 9
Proton NMR Spectra and Rate Processes • An NMR spectrometer is like a camera with a slow shutter speed • The NMR spectrometer will observe rapid processes as if they were a blur, i.e., only an average of the changes will be seen • When a 1H NMR spectrum of very pure ethanol is taken, the hydroxyl proton is split into a triplet by the two adjacent hydrogens • When an 1H NMR of regular ethanol is taken the hydroxyl proton is a singlet • Impure ethanol contains acid and base impurities which catalyze the exchange of hydroxyl protons • This rapid exchange is so fast that coupling to the adjacent CH2 is not observed • This process is called spin decoupling Chapter 9
Spin decoupling is typical in the 1H NMR spectra of alcohols, amines and carboxylic acids • The proton attached to the oxygen or nitrogen normally appears as a singlet because of rapid exchange processes Chapter 9
Carbon-13 NMR Spectroscopy • 13C accounts for only 1.1% of naturally occurring carbon • 12C has no magnetic spin and produces no NMR signal • One Peak for Each Unique Carbon Atom • Since the 13C isotope of carbon is present in only 1.1% natural abundance, there is only a 1 in 10,000 chance that two 13C atoms will occur next to each other in a molecule • The low probability of adjacent 13C atoms leads to no detectable carbon-carbon splitting • 1H and 13C do split each other, but this splitting is usually eliminated by adjusting the NMR spectrophotometer accordingly • The process of removing the coupling of 1H to an attached carbon is called broadband (BB) proton decoupling • Most 13C NMR, therefore, consist of a single peak for each unique carbon Chapter 9
13C Chemical Shifts • Just as in 1H NMR spectroscopy, chemical shifts in 13C NMR depend on the electron density around the carbon nucleus • Decreased electron density causes the signal to move downfield (desheilding) • Increased electron density causes the signal to move upfield (sheilding) • Because of the wide range of chemical shifts, it is rare to have two 13C peaks coincidentally overlap • A group of 3 peaks at d 77 comes from the common NMR solvent deuteriochloroform and can be ignored Chapter 9
Off-Resonance Decoupled Spectra • Broad-band decoupling removes all information about the number of hydrogens attached to each carbon • Off-resonance decoupling removes some of the coupling of carbons to hydrogens so that the coupled peaks will not overlap • Use of off-resonance decoupled spectra has been replaced by use of DEPT 13C NMR • DEPT 13C NMR • DEPT (distortionless enhanced polarization transfer) spectra are created by mathematically combining several individual spectra taken under special conditions • The final DEPT spectra explicitly show C, CH, CH2 , and CH3 carbons • To simplify the presentation of DEPT data, the broadband decoupled spectrum is annotated with the results of the DEPT experiments using the labels C, CH, CH2 and CH3 above the appropriate peaks Chapter 9
Example: 1-chloro-2-propanol • (a) The broadband decoupled spectrum and (b) a set of DEPT spectra showing the separate CH, CH2, and CH3 signals Chapter 9
Introduction to Mass Spectrometry (MS) • A mass spectrometer produces a spectrum of masses based on the structure of a molecule. • A mass spectrum is a plot of the distribution of ion masses corresponding to the formula weight of a molecule and/or fragments derived from it • The x-axis of a mass spectrum represents the masses of ions produced • The y-axis represents the relative abundance of each ion produced • The pattern of ions obtained and their abundance is characteristic of the structure of a particular molecule Chapter 9
The Mass Spectrometer • One common type is the Electron Impact Mass Spectrometer (EI MS) • Ionization (the formation of ions) • A molecule is bombarded with a beam of high energy electrons • An electron may be dislodged from the molecule by the impact, leaving a positively charged ion with an unpaired electron (a radical cation) • This initial ion is called the molecular ion (M+.) because it has the same molecular weight as the analyte • Fragmentation • Excess vibrational energy is imparted to the molecular ion by collision with the electron beam - this causes fragmentation • The fragmentation pattern is highly characteristic of the structure of the molecule Chapter 9
Ion Sorting • The fragments are sorted according to their mass to charge ratio, (m/z) • Most of the fragments detected have charge +1; the net effect is sorting of the ions by mass (m/z, where z = +1) • The charged molecular ion (M+) and fragments pass through an analyzer that sorts the ions according to m/z • One method of sorting involves directing the ions through a curved tube that passes through a magnetic field; as the magnetic field is varied, ions of different m/z values successfully traverse the tube and reach the detector • After ion sorting the results are plotted as a spectrum with m/z on the horizontal axis and relative abundance of each ion on the vertical axis Chapter 9
The Mass Spectrum • Data from a mass spectrometer can be represented as a graph or table • The most abundant (intense) peak in the spectrum is called the base peak and is assigned a normalized intensity of 100% • The masses are based on rounding of atom masses to the nearest whole number (in low resolution mass spectroscopy) • The data and fragmentation patterns for ammonia are as follows • The base peak for ammonia is the molecular ion, but this is often not the case Chapter 9
The small peak at m/z 18 comes from the small amount of 15N1H3 because of the small natural abundance of 15N compared to 14N • This peak is called an M+1 peak Chapter 9
Determination of Molecular Formulas and Molecular Weights • The Molecular Ion and Isotopic Peaks • The presence of heavier isotopes one or two mass units above the common isotope yields small peaks at M+.+1 and M+.+2 • The intensity of the M+.+1 and M+.+2 peaks relative to the M peak can be used to confirm a molecular formula • Example: In the spectrum of methane one expects an M+.+1 peak of 1.17% based on a 1.11% natural abundance of 13C and a 0.016% natural abundance of 2H Chapter 9
High-Resolution Mass Spectrometry • Low-resolution mass spectrometers measure m/z values to the nearest whole number • High-resolution mass spectrometers measure m/z values to three or four decimal places • The high accuracy of the molecular weight calculation allows accurate determination of the molecular formula of a fragment • Example • One can accurately pick the molecular formula of a fragment with a nominal molecular weight of 32 using high-resolution MS Chapter 9
Fragmentation • In EI mass spectrometry the molecular ion is highly energetic and can break apart (fragment) • Fragmentation pathways are predictable and can be used to determine the structure of a molecule • The processes that cause fragmentation are unimolecular • The relative ion abundance is extremely important in predicting structures of fragments • Fragmentation by Cleavage at a Single Bond • Cleavage of a radical cation occurs to give a radical and a cation but only the cation is observable by MS • In general the fragmentation proceeds to give mainly the most stable carbocation • In the spectrum of propane the peak at 29 is the base peak (most abundant) 100% and the peak at 15 is 5.6% Chapter 9
Fragmentation Equations • The M+. Ion is formed by loss of one of its most loosely held electrons • If nonbonding electron pairs or pi electrons are present, an electron from one of these locations is usually lost by electron impact to form M+. • Loosely held nonbonding electrons on nitrogen and oxygen, and p electrons in double bonds are common locations for an electron to be lost (i.e., where the remaining unshared electron in M+. resides) • In molecules with only C-C and C-H bonds, the location of the lone electron cannot be predicted and the formula is written to reflect this using brackets Chapter 9
Example: The spectrum of hexane Chapter 9
Example: spectrum of neopentane • Fragmentation of neopentane shows the propensity of cleavage to occur at a branch point leading to a relatively stable carbocation • The formation of the 3o carbocation is so favored that almost no molecular ion is detected Chapter 9
Carbocations stabilized by resonance are also formed preferentially • Alkenes fragment to give resonance-stabilized allylic carbocations • Carbon-carbon bonds next to an atom with an unshared electron pair break readily to yield a resonance stabilized carbocation • Z=N, O, or S R may be H Chapter 9
Carbon-carbon bonds next to carbonyl groups fragment readily to yield resonance stabilized acylium ions Chapter 9
Alkyl substituted benzenes often lose a hydrogen or alkyl group to yield the relatively stable tropylium ion • Other substituted benzenes usually lose their substitutents to yield a phenyl cation Chapter 9
Fragmentation by Cleavage of 2 Bonds • The products are a new radical cation and a neutral molecule • Alcohols usually show an M+.-18 peak from loss of water • Cycloalkenes can undergo a retro-Diels Alder reaction (section 13.11) to yield an alkadienyl radical cation Chapter 9
Carbonyl compounds can undergo a McLafferty Rearrangement • Y may be R, H, OH, OR etc. Chapter 9