Download
1 / 10
100 likes | 287 Views
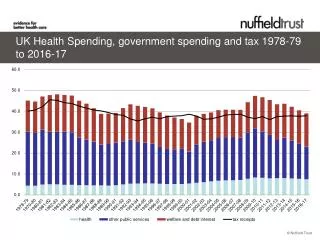
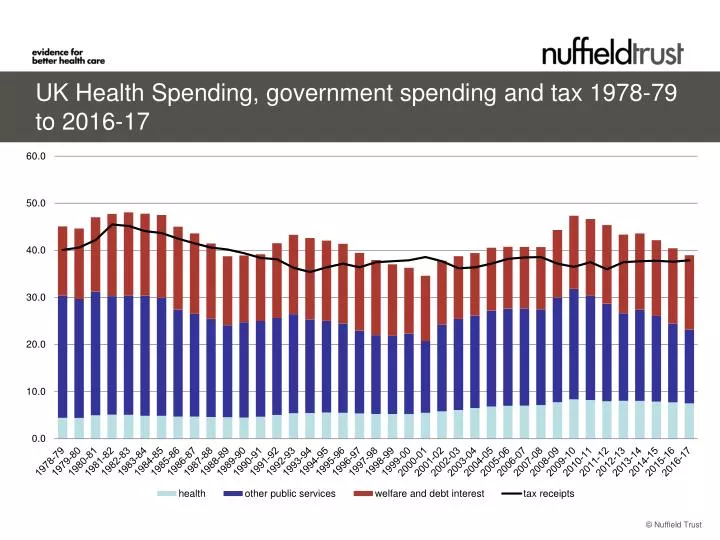
UK Health Spending, government spending and tax 1978-79 to 2016-17. The magic circle: health spending increases rapidly, overall public spending and tax falls. In 2016-17 spending as a share of GDP and receipts as a share of GDP will be at the average for the 20 years pre-crisis (40% and 38%).

E N D
UK Health Spending, government spending and tax 1978-79 to 2016-17
The magic circle: health spending increases rapidly, overall public spending and tax falls • In 2016-17 spending as a share of GDP and receipts as a share of GDP will be at the average for the 20 years pre-crisis (40% and 38%). • 2 key differences: Health spending will be much larger (2 percentage points of GDP) and spending on other public services will be at the share last seen in at the end of 1990’s. Source: OBR, HMT PESA 2012
Acute QIPP Actions: £4bn Disease management: £3bn Closing £13 billion Funding Gap: 2010/11 to 2014/15
Variation in labour productivity at selected providers in England: 2006/07 to 2011/12
Percentage changes in spending by type of care: 2010/11 to 2011/12
Closing £11 billion Funding Gap: 2014/15 to 2017/18 Releasing semi-fixed costs: £2bn Disease Management: £2bn Continued Pay Restraint: £3bn Remaining Gap: £3bn
Earnings will be key Source: OBR 2012, NHS employers 2012
Conclusions • From 2010/11 to 2014/15 the NHS faces its tightest budget of last 50 years. • This period of austerity is likely to extend at least until 2017-18. • Only a even larger cut in other public services or welfare or relatively large tax increases would allow NHS funding to grow at historic levels. 1p extra on income tax raises around £4 billion a year. • Without unprecedented productivity gains, there is likely to be a rapid growth in the gap between the demand for care and the ability to provide high-quality services. • Although the NHS is delivering headline savings its not clear that it is making the necessary progress on service productivity and models of care. • The scale of workforce cost growth after 2015 will be crucial.