Download
1 / 8
80 likes | 89 Views
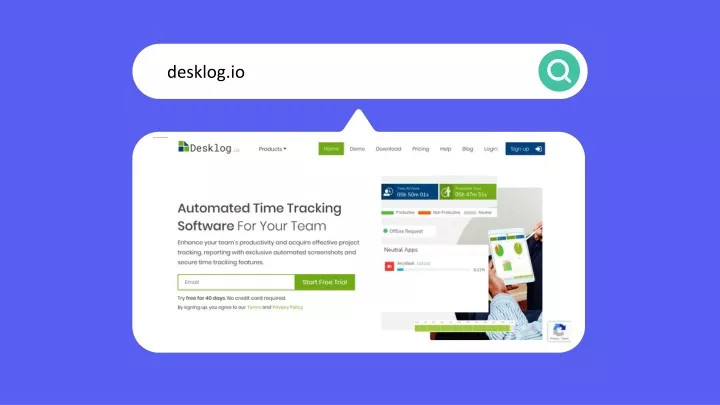
Once the users are added to the Desklog company account, they will be able to receive the invitation with credentials to log in to Desklog. The admin or the Desklog owner will be able to track the user.<br><br>Desklog will be able to track Applications, URLs, Documents, etc. The Desklog owner or the admin will be able to categorize the tracked application as either Productive or Non-productive or Neutral apps. Depending on what type of application is accessed by the user the productivity graph is displayed. The auto screenshots of the working window of the user will be capt

E N D
Tasks: The total number of assigned tasks which includes new tasks and pending tasks. Projects: The number of assigned projects. Completed Tasks: The number of completed tasks. To Do Task: The number of newly assigned tasks.
Productivity Graph: Pie chart representing how you spent time on productive or neutral or non-productive apps. Work Graph: Pie chart representing the worked time vs idle time vs private time to understand how often you go idle or avail private time during your working hours.
Productivity Bar: Each bar of the graph represents the combined time spent on productive, neutral, and non-productive apps. Each bar is differentiated with three different colors to know the three different times spent during hourly intervals. Report Graph: It is a combined graph of the completed task time, productive and idle time for the day or for the week or the month.
Productive Apps NeutralApps Non-Productive Apps
1 Productive Apps: List of productive apps accessed by the user and the time spent on it. Non Productive Apps: List of non-productive apps accessed by the user and the time on it. 2 Neutral Apps: List of neutral apps accessed by the user and the time spent on it. 3 Tracked Apps are Categorised as:
Mail To : support@desklog.io For More….. desklog.io
