1 / 0

Chapter 5: Supply

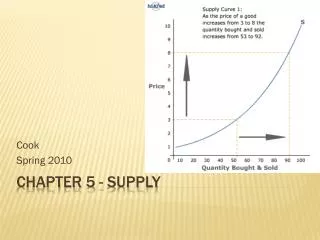
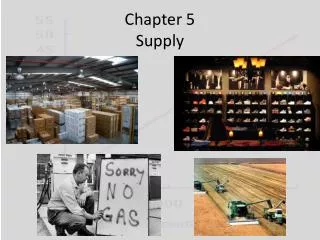
Chapter 5: Supply. Get Books/Workbooks/Notes Ready Fill out pg. 41 as Warm-up for Supply Copy down Chart on pg. 109. Chapter 5 Section 1. “How do suppliers decide what goods/services to offer?” Objectives Explain law of demand Interpret supply schedule and graph

deva
Download Presentation

Chapter 5: Supply

An Image/Link below is provided (as is) to download presentation Download Policy: Content on the Website is provided to you AS IS for your information and personal use and may not be sold / licensed / shared on other websites without getting consent from its author. Content is provided to you AS IS for your information and personal use only. Download presentation by click this link. While downloading, if for some reason you are not able to download a presentation, the publisher may have deleted the file from their server. During download, if you can't get a presentation, the file might be deleted by the publisher.

E N D

Presentation Transcript


  1. Chapter 5: Supply Get Books/Workbooks/Notes Ready Fill out pg. 41 as Warm-up for Supply Copy down Chart on pg. 109
  2. Chapter 5 Section 1 “How do suppliers decide what goods/services to offer?” Objectives Explain law of demand Interpret supply schedule and graph Examine relationship b.t. elasticity of supply and time Key Terms http://www.pearsonsuccessnet.com/snpapp/iText/products/0-13-369833-5/Flash/Ch05/Econ_OnlineLectureNotes_ch5_s1.swf
  3. Introduction How does the Law of Supply affect qty supplied? As prices rise, producers want to and will offer more of a good and new suppliers will enter the market in hopes of profit Law of supply states that as prices rise, so will quantity supplied.
  4. Law of Supply: Price = only factor Supply is the amount of goods available As price of good increases, producers offer more As price of good decreases, producers offer less Includes 2 movements Individual firms changing their level of production Firms entering or exiting the market Higher Production If a firm is earning a profit from sale of good/service…. Then an increase in price alone will, in turn, increase firm’s profits Search for profits is what drives the choices made by producers
  5. Supply Schedule Supply of a good can be measured using supply schedule Shows relationship bt price and qty. supplied of good Indiv. Supply schedule shows how much of a good a single supplier will be able to offer at various prices Market supply schedule shows how much of a good ALL firms in a particular market can offer at various prices Figure 5.1 (112) What does ISS tell you about pizzeria owners decisions? How does MSS compare to ISS?
  6. Supply Graph Supply graph can be represented graphically ALWAYS rises from left to right b/c higher prices leads to higher output
  7. Elasticity of Supply: Read 114-115 Based on same concept of Elasticity of Demand Measures how firms will respond to changes in the price of a good Elastic When elasticity is greater than one, supply is very sensitive to price changes Inelastic Less than one, supply is not very responsive to price change Elasticity in Short run: Supply is inelastic B/c firms have difficulty changing output levels fast Example: Agriculture (Orange-grove from book) Elasticity in Long run: Supply is more elastic Like demand, supply becomes more elastic if supplier has longer time to respond to change
  8. Lesson Closing Quick Review: TPS w/Partner How does a highly elastic business respond to price falls? “Simple Supply Demand” Video During Video Work on Pg. 42 in workbook Supply Schedules/Curves wrksht in workbook Homework ?s for tomorrow Work w/partner Answer Critical Thinking 6-9: pg.115
  9. Bell Work Section 2 2 Min. to finish Critical Thinking from Section 1
  10. Finish Critical Thinking Sect. 1 Example of variable other than price for each of these markets Rock bands concert tour Number of dates they play, seats in arenas Electronic equipment maker Supply of comp. chips for equip., other supplies Bakery Seasonal demand Price of gold rises what happens to 2nd hands? Supply will increase (@higher prices) to profit Elastic of Inelastic? Lawn care Elastic; entry cost low Making Movies Inelastic: expensive and time consuming Baseball Inelastic: costs are high and players are not manufactured
  11. Chapter 5 Section 2 “How can a producer maximize profits?” Objectives How firms decide how much labor to hire in order to produce certain output Analyze production costs of firms How firms choose to set output Factors that a firm considers before shutting down a profitable business Key terms http://www.pearsonsuccessnet.com/snpapp/iText/products/0-13-369833-5/Flash/Ch05/Econ_OnlineLectureNotes_ch5_s2.swf
  12. How can a Producer maximize Profits? When thinking about how to maximize profits, producers think about the cost involved in producing one more unit of a good Costs producers take into consideration are: Operating cost Variable cost Total cost Marginal cost
  13. How firms decide: Labor and Output All businesses must decide how many workers they will hire The addition of new workers will increase production to a point, then it will decrease Increasing/Decreasing marginal returns
  14. How Firms Decide: Marginal Returns Addition of workers allows for greater specialization. (refer to figure 5.4 pg.117) Specialization increases output Increased output leads to firms increasing marginal returns Eventually the addition of workers will increase output but less and less. Diminishing marginal returns means a firm will produce less/less with each added unit of labor
  15. Production Costs Divided into 2 categories Fixed Costs (stay same) Mainly involve the production facility Rent, machine repair, property taxes, salaries Variable Costs (change w/output) Price of Raw materials, other labor, electricity/heating bills Total Cost Sum of fixed and variable costs
  16. Marginal Cost of Production Knowing total costs of several levels of output helps a firm determine the marginal costs of production at each level Or the additional costs of producing one more unit Best way to find Marginal cost of production Find where marginal cost is equal to marginal revenue (or additional income from selling 1 more) Understand Chart on pg. 120: Answer 2 ?s
  17. Setting Output: Determining Profit Primary goal is to maximize profit Wants to make most profit with least amount of total production costs Average cost = TC / Quantity produced Figure 5.6 on pg. 121 Answer 2 ?s
  18. Shutdown Decision What happens when a factory starts to lose money? Sometimes, even though a factory is producing at its most profitable level, the market prices are so low that the factory’s TR is still less than its TC Leads owners to 2 choices Continue to produce and lose money When? : If the TR from the goods is greater than cost of keeping factory open Would work if benefit of operation is greater than VC Shut down factory Still has to pay all of FC but nothing coming in Lose an amount equal to FC
  19. Production Costs
  20. Lesson Closing Answer Critical Thinking (122) 7-9 For tomorrow Work on Workbook pages 43, 62 Watch Pearson Videos for Ch. 5 How the Economy Works Visual Glossary
  21. Chapter 5 Section 3 BW: Finish up Critical Thinking
  22. Critical Thinking (122) Other than reducing staff how would you recommend improving performance? Raising Prices, upgrading facilities/equipment, and encourage specialization to increase productivity Would you add same workers to each facility? Why/why not? Add workers faster to larger b/c more capacity Why would a company make more if its marginal cost is less than marginal revenue? Increasing profit Why would they simply not make more/more? Marginal return will diminish sometime, reducing profits
  23. Chapter 5 Section 3 “Why does the supply curve shift?” Objectives Explain how some factors create changes in supply Three ways the govt. can influence supply Analyze other factors affecting supply How firms choose a location for production Key Terms Subsidy: Govt. payment that supports a business or market Excise Tax: tax on production or sale of good Regulations: Govt. intervention in a market that affects the production of a good
  24. Introduction Why does the supply curve shift? Several factors cause the supply curve to shift Shifts in prices Rising Costs Technology Changes in Global economy Future expectations of prices Number of suppliers
  25. Input Costs Any changes in the cost of an input to make a good will affect supply Rise in cost of raw materials would result in decrease in supply b/c good has become more expensive to produce Rising costs make a firm have to cut production and lower its marginal cost It is possible for input costs to drop Industries w/advancements in technology Examples Automation Computer E-Mail
  26. Governments Influence on Supply Govt. also has power to affect supplies of many goods Subsidies Gives subsidies to producers of a good Generally lower costs, which allow firm to produce more Reasons Provide people during a shortage Protect young industries from foreign competition Taxes Excise taxes increase production costs by adding an extra cost to each unit sold. Used to discourage a good deemed harmful Cigarettes/alcohol Regulation Indirectly, often raises costs EX: Govt. regulation on auto pollution; regulations led to increase in cost of making cars
  27. Other Influencing Factors Changes in global economy Many goods imported, changes in other countries can affect supply of those goods Increase in wages in one country or the increased supply of a good in another will cause supply curve to shift Restrictions on imports also affect supply
  28. Shift in Supply Curve Factors that reduce supply shift to left Factors that increase supply shift to right Which represents effect of higher costs? Decrease in supply Which represents advances in technology? Increase in supply
  29. Checkpoint: other influences What happens to supply if the price of a good is expected to rise in future? Seller would/should store good to sell more in the future If price is expected to fall? Place goods on market now, before price falls
  30. Last Influence: Number of Suppliers More suppliers in a market, the higher supply Curve will shift to right Suppliers leaving market will decrease supply Curve shifts to left Where do firms Produce Key factor in location of a firm is transportation Inputs (materials) are costly to transport, firm will locate there (mills, mining areas, etc) Outputs (final goods) are more costly to transport, firms locate there: (bulky/perishable goods) bottling comp.’s
  31. Lesson Closing Case Study Video Work on Workbook Due Tuesday!! Study Day on Monday!!
More Related