Download
1 / 40
470 likes | 676 Views
Improving Design Quality by Managing Process Variability . ISQED ’09 San Jose, CA Terry Ma. CONFIDENTIAL INFORMATION

E N D
Improving Design Quality by Managing Process Variability ISQED ’09 San Jose, CA Terry Ma
CONFIDENTIAL INFORMATION The following material is being disclosed to you pursuant to a non-disclosure agreement between you or your employer and Synopsys. Information disclosed in this presentation may be used only as permitted under such an agreement. LEGAL NOTICE Information contained in this presentation reflects Synopsys plans as of the date of this presentation. Such plans are subject to completion and are subject to change. Products may be offered and purchased only pursuant to an authorized quote and purchase order. Synopsys is not obligated to develop the software with the features and functionality discussed in the materials.
Outline • Introduction • Sources of Process Variability • Modeling Process Variability • Design-Centric Process Variability Analysis • Design-Centric Yield Management • Summary
Moore’s Scaling Source: IMEC • Stress engineering implemented at 65nm enables continued scaling <15nm 22nm 32nm 45nm 65nm 90nm
Si3N4 stress cap NiSi Si3N4 35nm NiSi NMOS NiSi 1.2nm SiGe SiGe Leakage PMOS Stress Band Structure Vt Mobility What exactly does stress do? Gate SiGe Lattice distortion Si • Unlike humans, transistors perform better under stress!
Unfortunately, stress is everywhere… Each object (diffusion, poly, contact, well edge, …) contributes to stress!
P-Channel P 0.98 0.95 0.86 0.95 0.86 1.03 0.95 0.8 N-Channel 0.74 0.78 0.95 0.8 0.74 N 0.78 0.8 0.74 Transistor Position If you look inside a standard cell… As much as 25% variation in current across a standard cell
Cell context can become a problem too…. Adjacent cells Cell under analysis Ambit size Minimum gate width for 45nm node is ~0.5 um 32nm 0.18mm 0.13mm 90nm 65nm 45nm Technology Gate size (um2) 5.3x2.0 3.7x1.4 2.6x1.0 1.8x0.7 1.3x0.5 0.91x0.35
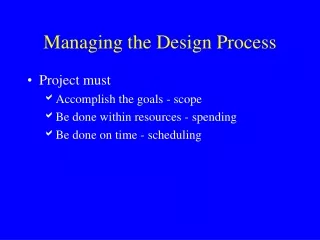
Oops! The price to pay…. Systems Design Manufacturing Slip! Cost/Change Cost 1X Design Tapeout Production Time
Outline • Introduction • Sources of Process Variability • Modeling Process Variability • Design-Centric Process Variability Analysis • Design-Centric Yield Management • Summary
Sources of Layout Proximity Variation Litho Proximity Mechanical Stress/Strain Well Proximity Modeling of electrical variation (caused by physical variation) to account for proximity effects is crucial for design Electrical Variation Circuit Variation
Lithographic Proximity Variation physical shape variation • Sub-wavelength lithography • CD Variation • Corner Rounding Transistor Drain Current • Drive Current • Leakage • Capacitance • Delay Electrical variation Physical shape variation
Stress-Induced Ion Variation @ 45nm Layout A Layout C P2P=120nm W=100nm W=100nm #1 #2 #3 #4 #5 #1 #3 #5 Layout B (Transistors in Layout A are used for Ion reference) ~25% Ion variation even for simple layouts! #1 #2 #3 #4 #5
Well Proximity Effect • Implant atoms bounce off of photoresist • Extra dopant in channel region changes Vth, body effect • Depends strongly on well / isolation layouts
Complex Layout Effects • Jogs (L, H, U, Z, … shapes) • SA (length of diffusion) • DL (longitudinal diffusion spacing) • DT (transverse diffusion spacing) • SDP (active-to-dummy poly) • P2P (poly space) • WA (DSL and WPE) • DB (distance to boundary) H DL DB SDP jogs DB WA DT P2P SDP SA Poly spacing variation still exists, despite effort to follow restrictive design rules (RDR) – poly-on-grid Active diffusion jogs and corner rounding remain pervasive
350nm 250nm 180nm Timing Closure! 130nm 90nm Power Verification Signal Integrity 65nm 45nm 32nm Power! Verification! Yield 22nm Power!! Verification!! Clocks Power!!! Verification!!! Yield! Power!!! Verification!!!! Yield!! Variability Added Design Challenges
Outline • Introduction • Sources of Process Variability • Modeling Process Variability • Design-Centric Process Variability Analysis • Yield Management for Design • Summary
L W szz sxx Si STI STI syy Length of Diffusion How to bridge process and design? Design Layout Process Transistor
Designer’s Care-about • Everything starts with Spice Accurate Cell Library Characterization Annotated Spice Netlist Spice Simulations Critical Path Analysis Sign-off
From Physics to Compact Model Physical Modeling Compact Model
From Layout to Spice Instance Parameters Litho Back-annotated Spice Instance Parameters (MULU0, DELVT0, L, W, …) Stress Layout Geometry Processing Physics-based Compact Models (m/mref, DVth, DL, DW, …) WPE Others
Outline • Introduction • Sources of Process Variability • Modeling Process Variability • Design-Centric Process Variability Analysis • Design-Centric Yield Management • Summary
Stress sxx syy szz Visualization Annotated SPICE Netlist HSPICE, HSIM, NanoSim Design-Centric Process Variability Tools Si Calibrated Stress Model Seismos LX: Stress to Electrical Seismos CX: Contour to Electrical Layout Weq Litho Contour Leq
Library/Cell Design Flow Drop-in Schematic Layout Tech File Stress Model Physical Verification Device & RC Extraction Seismos Annotated Netlist Instance Parameters: meff, Vth, Leff, Weff Spice Simulation
Model-Based Approach Accuracy Desirable 45o target
Handling tricky layout… Leads to Tensile longitudinal Stress at bottom edge Compressive STIstress pushes Side of Diffusion edge In a complex layout, physics-based approach can handle very well the changes in stress behavior at diffusion corner
Visualizing Mobility Variation Across a Cell strong weak
Shrink Diff Add Dummy dummy dummy • weaken nmos • enhance pmos • enhance nmos • weaken pmos Doing What-if Analysis Original • Integrated with IC-Workbench • Layout editing, with instant in-place mobility analysis pmos nmos
Device and Timing Characteristics SiGe + STI (dense) (sparse) • Back-annotated netlist is used for Spice simulations Sparse Dense 3-stage ring oscillator
Analyzing Cell Context Effects BUFX4 Filler4 BUFX4 BUF Filler4 BUF BUF NAND2 NAND2 NAND2 NAND2 NAND2 BUFX2 Filler2 Filler2 (d) (e) (c) (b) (a) Context Dependent Delay Variation • Context dependent timing variation can be evaluated to determine • Sensitivity • Distribution • Derating factor, …
Example: 40nm 24x Inverter 100 Random Contexts – 2 Timing Arcs worst best worst best Context analysis reveals timing variations, and best and worst case neighbors
Outline • Introduction • Sources of Process Variability • Modeling Process Variability • Design-Centric Process Variability Analysis • Design-Centric Yield Exploration • Summary
New Paradigm in Yield Management FAB TEST EDA DRC / CAA Measurement and Inspection Functional Test Results Parasitics ATPG Tests Arrays Tests STA Wafer History DFT Diagnosis Fail Classification LCC / CMP Equip. History Parametric Test Results Stress Yield Management System Characterization Results Statistics and DataMining Physical Design Data Data Visualization / Correlation Layout Engineer Test Engineer Process Engineer FA Engineer Faster FA Process Fix Program Fix Design Fix
Design-Centric Yield Management Multi-Tool Manual Flow 2-3 Weeks • Single Data Bank for yield relevant data from Design, Fab and Test • An order of magnitude faster systematic failure localization Physical FA 50% Accurate Low Yield Lot Cell Fail By Test Failing Cell Map Spatial Trends Failing Cells and Nets Failing Nets On Layout Yield Explorer Automated Flow 2-3 Days Physical FA >90% Accurate Low Yield Lot
Outline • Introduction • Sources of Process Variability • Modeling Process Variability • Design-Centric Process Variability Analysis • Design-Centric Yield Exploration • Summary
Summary Stress engineering added to boost transistor performance at 65nm and below increases process variability Interactions between design features and physical processes result in systematic defects that can degrade design quality and yield in manufacturing Design modification made after tapeout and in manufacturing cannot fix everything and is costly For 45nm and below, design quality and yield can be improved by properly managing process variability