Download
1 / 15
150 likes | 304 Views
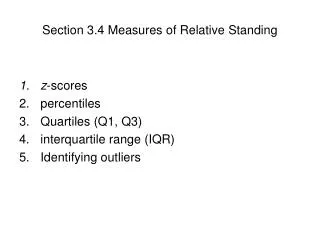
Measures of Relative Standing. Percentiles z-scores T-scores. Percentiles/Quantiles. Percentiles and Quantiles The sample k th percentile ( P k ) is value such that k % of the observations in the sample are less than P k and (100 – k )% are greater

E N D
Measures of Relative Standing Percentiles z-scores T-scores
Percentiles/Quantiles • Percentiles and Quantiles The sample kth percentile (Pk) is value such that k% of the observations in the sample are less than Pkand (100 – k)% are greater • E.g. 90th percentile (P90) is a a value such that 90% of the observations have smaller value and 10% of the observations are greater in value. • Quantile is just another term for percentile, e.g. JMP refers to percentiles as quantiles.
Quartiles • Quartiles are specific percentiles • Q1 = 1st quartile = 25th percentile • Q2 = 2nd quartile = 50th percentile • Q3 = 3rd quartile = 75th percentile = Median
Boxplot Maximum = x(n) Median Q1 Q3 Outliers Minimum = x(1) IQR = Interquartile Range which is the range of the middle 50% of the data
Definition of z-score Population z-score Sample z-score In either case, the z-score tells us how many standard deviations above (if z > 0) or below (if z < 0) the mean an observation is.
Interpretation of z-Scores • If z = 0 an observation is at the mean. • If z > 0 the observation is above the mean in value, e.g. if z = 2.00 the observation is 2 SDs above the mean. • If z < 0 the observation is below the mean in value, e.g. if z = -1.00 the observation is 1 SD below the mean.
0.1% The Empirical Rule (z-scores) 99.7% of data are within 3 standard deviations of the mean 95% within 2 standard deviations 68% within 1 standard deviation 34% 34% 2.4% 2.4% 0.1% 13.5% 13.5% 0 3.00 -3.00 2.00 -2.00 -1.00 1.00 z-score
The Empirical Rule (z-scores) Therefore for normally distributed data: • 68% of observations have z-scores between -1.00 and 1.00 • 95% of observations have z-scores between -2.00 and 2.00 • 99.7 of observations have z-scores between -3.00 and 3.00
Outliers based on z-scores • When we consider the empirical rule an observation with a z-score < -2.00 or z-score > 2.00 might be characterized as a mild outlier. • Any observation with a z-score < - 3.00 or z-score > 3.00 might be characterized as an extreme outlier.
Example: z-scores Q: Which is more extreme an infant with a gestational age of 31 weeks or one with a birth weight of 1950 grams? Calculate z-scores for each case. Gestational Age = 31 weeks Birthweight = 1950 grams Because the z-score associated with a gestational age of 31 weeks is smaller (more extreme) we conclude that it corresponds to more extreme infant.
Note: When standardized the mean is 0 and standard deviation is 1! Standardized Variables We can convert each observed value of a numeric variable to its associated z-score. This process is called standardization and the resulting variable is called the standardized variable.
T-Scores ~ Another “Standardization” Facts About T-scores • Have a mean of 50. • Have a standard deviation of 10. • May extend from 0 to 100. • It is unlikely that any T-score will be beyond 20 or 80 (i.e. 3 SD’s above and below the mean) Definition of T-Score
68% 95% 99.7% Empirical Rule: z- and T-scores
T-Scores T-scores may be used in same way as z-scores, but may be preferred because: • Only positive whole numbers are reported. • Range from 0 to 100. However, they are sometimes confusing because 60 or above is good score, BUT not if we are taking a 100 point exam!