Download
1 / 32
320 likes | 442 Views
Introduction to Economics. Egor Sidorov. Demand Supply Market equilibrium. Demand. the certain quantity of goods the consumers are ready to buy at the moment at the certain price. Note: Demand will be “economic demand” only in case the consumers have enough money to buy the goods needed.

E N D
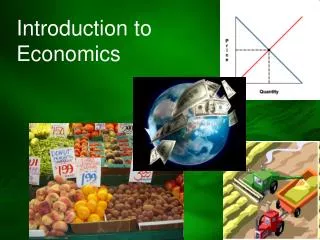
Introduction to Economics Egor Sidorov
Demand Supply Market equilibrium
Demand • the certain quantity of goods the consumers are ready to buy at the moment at the certain price. Note: Demand will be “economic demand” only in case the consumers have enough money to buy the goods needed. Preferences Resourses Decision 23. 9. 2014 3
Law of downward-sloping demand: 2 reasons for it • When the price of commodity raises (ceteris paribus) buyers tend to buy less of the commodity. • Substitution effect: consumer substitutes the more expensive good by less expensive and therefore decreases his demand for it. • Income effect: when all the prices go up the consumer feels himself relatively poorer than before (i.e. real income goes down). In this respect he decreases his consumption.
Demand function • Given other things being equal (e.g. tastes, income, preferences, etc. do not change) the certain relation between price (P) and quantity demanded (Q) exists. • This relation is called a demand function Q=f(P), that can be visualized by a demand curve. P (price, thous. USD) 30 25 20 Given: If the demand curve is ►, the demand function is: Q = 4 – 0,1xP 15 10 5 Q (pieces) D 2 3 1 4 5 6
Moving the curve vs. moving along the curve ◄ Change of quantity demanded: If no other factor, except the price, change – the movement is observed only along the curve P P 30 30 25 25 20 20 Change of demand► When the non-price factors change (e.g. our budget increases) we observe the movement of the curve itself. . 15 15 10 10 5 5 Q Q 2 2 3 3 1 1 4 4 5 5 6 6
What factors determine demand? • Consumer income • We tend to buy more as the income grows • Market size • E.g. measured by population • Preferences and tastes • Culture, history, psychological and physical needs. • …
What factors determine demand? • Price and accessibility of related goods • Substitute goods: goods that can be consumed or used in place of one another. • Complement goods: goods which can be consumed only with another good.
Price elasticity of demand • It indicates sensitivity of quantity demanded to price changes (i.e., shows how consumers respond to price changes) E>1 P 30 25 20 E<1 15 10 5 It tells us what percent change in the quantity demanded for a good will follow a one percent increase in the price of that good. Q 2 3 1 4 5 6
Price elasticity of demand • Factors: fashion, preferences, good necessity, time for consumers’ reaction, etc. • Types of demand price elasticity 1/2 • Absolutely elastic demand: E=∞ (small price changes lead to infinite change of the quantity demanded). • Elastic: E>1 (e.g., planned flight). P D1 D2 Q
Price elasticity of demand • Types of demand price elasticity 2/2 • Unitary elastic: E=1. • Non-elastic: E<1 (e.g., unplanned flight). • Absolutely non-elastic: E=0 (quantity demand doesn’t react on price changes). P D3 D2 D1 2 ▼50 % ▼50 % ▼50 % 1 Q Q Q ▲200 % ▲50 % ▲25 %
What do we need price elasticity indicator for? • Company price policy before all: • Price discrimination: e.g. flight companies determine customer groups with different price elastic ties • Sales in the supermarkets
Price strategies • If the demand is elastic it is sensible to decrease price, since it will be compensated by the growth of sales► Loss P P Additional income 30 30 25 25 20 20 15 15 If the demand is non-elastic it is sensible to increase the price ◄ 10 10 5 5 Q Q 2 2 3 3 1 1 4 4 5 5 6 6
Price strategy choice • Say we are selling tomatoes (100 USD per box). • Say we have read in the Financial Times that the price elasticity of demand for tomatoes is E = 2. 90 120 10 800 110 80 8 800
Price strategy choice • PSay we are selling aspirin (100 USD per box). • Say we have read in the Economist magazine that the price elasticity of demand for aspirin is E = 0,5. 90 105 9 450 110 95 10 450
Demand Supply Market equilibrium
Supply • the quantities of any particular good which the firms are willing to make available at the variety of prices.
Supply function • Given other things being equal (e.g. technology, taxes, number of sellers, etc. do not change) the certain relation between price (P) and quantity supplied (Q) exists. • This relation is called a supply function Q=f(P), that can be visualized by a supplycurve. P 30 25 20 The positive slope reflects that higher prices mean higher profits and attract more producers►, supply function is: Q =0,2xP – 2 S 15 10 5 Q 2 3 1 4 5 6 18 18
Moving the curve vs. moving along the curve ◄ Change of quantity supplied: If no other factor, except the price, change – the movement is observed only along the curve P P 30 30 25 25 20 20 Change of supply► When the non-price factors change (e.g. technology) we observe the movement of the curve itself. . 15 15 10 10 5 5 Q (ks) Q (ks) 2 2 3 3 1 1 4 4 5 5 6 6
Factors influencing supply • Prices of inputs • Determine the production costs and therefore profits • Technology • Determines factor productivity and efficiency. • Prices of related goods • Especially those, produced by the same company
Factors influencing supply • Governmental policy • Taxes, minimum wages, environmental policy, etc. • Number of sellers • Higher profits attract competitors • Expectations • E.g. Olympic games attracts businessmen to the venue site
Price elasticity of supply • It indicates sensitivity of quantity supplied to price changes (i.e., shows how producers respond to price changes) • Price elasticity of supply is influenced before all by • production extension possibilities in reaction to price change • and time horizon – the supply is more elastic in the long run. vs. vs.
Demand Supply Market equilibrium
Market equilibrium • the point, where the amount of goods the consumers are ready to buy at the certain price is equal to the amount the producers are ready to supply. • AB – Surplus. • CD – Deficit P (cena, tis. Kč) 30 A B A B 25 20 E E 15 10 5 Q C D C D 2 3 1 4 5 6 24 24 24
Demand change • If the demand curve moves to the right, it will lead to deficit at the initial price level. The price will be pushed up until the new equilibrium state. P 30 25 E’’ 20 15 E 10 5 Q 2 3 1 4 5 6
Supply change • If the supply curve moves to the right, it will lead to surplus at the initial price level. The price will be pushed down until the new equilibrium state. P 30 25 E 20 15 E’’ 10 5 Q 2 3 1 4 5 6
Achieving equilibrium: dynamic model • Converging case P 30 A 25 20 15 10 5 Q 2 3 1 4 5 6
Achieving equilibrium: dynamic model • Diverging case P 30 25 A 20 15 10 5 Q 2 3 1 4 5 6
Price mechanism • Prices and producers • Information and motivation signals – higher prices attract producers • Market niche ► deficit ► price growth ► new market players ► supply increase► surplus► prices go down►producers leave the market • Prices and consumers • Information and motivation signals – low prices and marketing campaigns stimulate consumers to buy luxury and normal goods; high prices lead to consumption decrease
„Invisible hand of market“ • Adam Smith (1723-1790) – has introduced this concept explaining the efficient market mechanism. • Given the perfect competition and absence of market failures the market is capable of producing as many goods and services as it is possible with the accessible resources. • However, market failures (e.g., monopoles, environmental pollution, etc.) reduce the efficiency of this mechanism.
State interventions • Taxes and subsidies • Minimum prices • E.g. minimum wages► • Price ceilings • Bus tickets W Wmin Wtrh Q
Thank you for attention! Sources: SAMUELSON, P. A., NORDHAUS, W. D. Ekonomie 18. vydání.Praha: Svoboda, 2005. KRAFT, J., RITSCHELOVÁ, I. Ekonomie pro environmentální management. Ústí n. L.: UJEP, 2003. MCDOUGAL LITTELL. Economics: Concept and Choices. Canada: McDougal Littell, 2008.