Download
1 / 24
240 likes | 373 Views
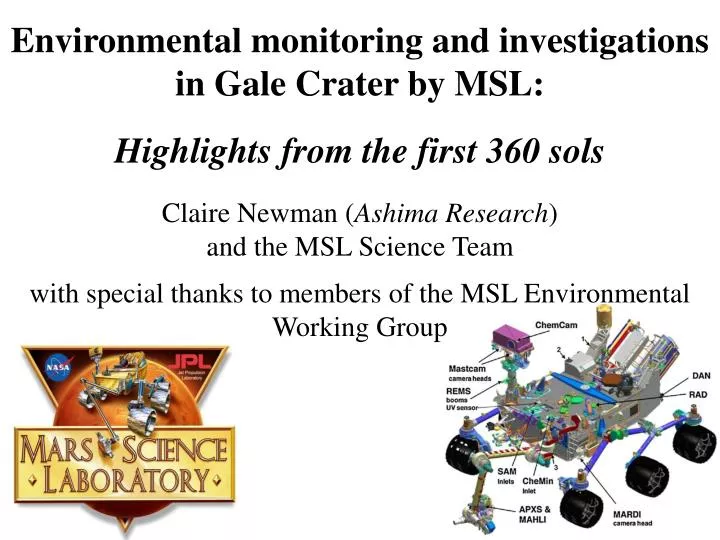
Environmental monitoring and investigations in Gale Crater by MSL: Highlights from the first 360 sols Claire Newman ( Ashima Research ) and the MSL Science Team with special thanks to members of the MSL Environmental Working Group . Overview of MSL’s environmental instrument suite.

E N D
Environmental monitoring and investigations in Gale Crater by MSL:Highlights from the first 360 solsClaire Newman (Ashima Research)and the MSL Science Teamwith special thanks to members of the MSL Environmental Working Group
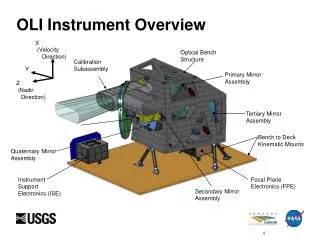
Dedicated environmental sensors on MSL The Rover Environmental Monitoring Station (REMS) In this self-portrait, boom 1 is hidden behind the rover mast (A) Ground temperature sensor on boom 1 (not shown) (B) Wind sensor on boom 1 (not shown, and was damaged on landing) and boom 2 (shown) (C) Relative humidity sensor on boom 2 (D) Air temperature sensor on boom 1 (not shown) and boom 2 (shown) (E) UV sensor on the rover deck (F) Pressure sensor inside the rover body
Dedicated environmental sensors on MSL The Radiation Assessment Detector (RAD) [see later talk by Zeitlin et al.] Measures abroad spectrum of energetic particle radiation
Dedicated environmental sensors on MSL The Dynamic Albedo of Neutrons instrument(DAN) [see later talks by Litvak et al. and Moersch et al.] Pulsed neutron generator (used in active mode) Detector and electronics Measures thermal and epithermal neutrons to infer sub-surface water abundance and (in active mode) vertical distribution in 1st ~m below surface
Many investigations also being performed by: • MSL’s cameras (Mastcam, Navcam, MAHLI, …) [see e.g. previous talk by Bell et al.] • ChemCam spectroscopy [see e.g. Wednesday talk by Mcconnochie et al.] • Sample Analysis at Mars (SAM) instrument [see e.g. later talks by Mahaffy et al. and Webster et al.]
Motivation for environmental monitoring • Gives context for wide range of studies & experiments • Provides data for future mission planning • Massively expands record of in situ Mars meteorology • Measuring the current environment helps identify ancient vs. new features and processes • Understanding the current environment is vital for extrapolating to the past • Provides insight into past climate states
Selected highlights from MSL’s environmental investigations
Water in the atmosphere [REMS RH] Diurnal cycles of temperature and relative humidity over three sols 0 sol 17 sol 15 sol 16 100 -20 50 -40 Temperature (°C) Relative humidity -60 0 -80 RH simulated for vmr = 140 ppm RH simulated for vmr = 100 ppm RH simulated for vmr = 60 ppm Measured RH Temperature (K) -50 -100 00:00 12:00 00:00 12:00 12:00 00:00 00:00 Local time of day NOTE: Data are preliminary. See Harri et al., JGR (2013) for more details of the RH sensor
Water in the atmosphere [REMS RH] Seasonal evolution of early morning temperature and water volume mixing ratio consistent with orbital data 140 120 Southern Winter Southern spring Southern summer 100 80 -60 Volume mixing ratio (ppm) Temperature (°C) -70 60 -80 40 20 0 50 100 150 200 250 300 350 Mission sol Leave blast zone Start rapid transit route Arrive in Rocknest Leave Rocknest Arrive at Yelloknife NOTE: Data are preliminary. See Harri et al., JGR (2013) for more details of the RH sensor
Water in the surface [DAN] Most DAN active data fit a 2-layer model with a relatively water-poor top layer; wt% consistent with SAM soil analysis DAN modeled weight % water along rover track water in bottom layer water in top layer (~top 10-20cm) See later talks by Litvak and Moersch, and papers by Jun, Litvak, and Mitrofanov, et al., JGR (2013)
Aeolian features and processes [cameras] Dunes near Mount Sharp (from orbit) Ventifacts in Hottah Plausible wind directions based on dune morphology Rocknest ‘sand shadow’ Jake Matijevic rock Obstacles sand Inferred directions wind comes from based on ventifact orientations [From Bridges et al., JGR (2013)]
Aeolian features and processes [REMS wind] Sol 38-55 Sol 55-120 Sol 121-160 REMS wind directions at 4 times of day in 3 periods 13:00-14:00 N 09:00-10:00 21:00-22:00 18:00-19:00 REMS team • REMS (and model) wind directions more consistent with winds implied by dunes than by rock abrasion features [see tomorrow’s Bridges et al. poster] • May indicate dunes more recent, while rocks hold record of ancient winds
Aeolian features and processes [REMS, Mastcam] Experiments to estimate threshold for particle motion:Constant REMS wind monitoring between 2 Mastcam images Ifchange detected => REMS peak winds give upper limit on threshold If NO change seen=> REMS peak winds give lower limit on threshold Image1: sol 232, 12:03 LMST Image2: sol 232, 12:46 LMST 3 sets of experiments, each using a pair of images of a post-drilling dump pile Found NO change between images, and peak REMS winds ~16m/s Suggests surface stress must exceed ~0.02-0.04 Pa for particles to move
Topography and the circulation [REMS wind] Sol 38-55 Sol 55-120 Sol 121-160 As shown before, flow is not simply ‘daytime upslope / nighttime downslope’ with respect to Mount Sharp 13:00-14:00 N 09:00-10:00 Downslope during the day 21:00-22:00 18:00-19:00 N Upslope at night REMS team
Topography and the circulation [REMS pressure] Enhanced daily range in REMS surface pressure compared to ALL prior landing sites measured Mars Pathfinder MSL 3 sols of pressure data 2 sols of pressure data 680 sol 9 670 Pressure (Pa) Peak amplitude ~ 4.5% Peak amplitude ~ 13% sol 19 660 650 Schofield et al., 1997 Haberle et al. 2013b Main cause is hydrostatic adjustment along major slopes in Gale in response to daily air temperature cycle [Richardson et al., JGR 2013]
Surface properties [REMS Tground] Modeling REMS’s daily ground temperature cycle 0 4 8 12 16 20 24 0 4 8 12 16 20 24 0 4 8 12 16 20 24 Hour (LMST) Hour (LMST) Hour (LMST) • Vary model parameters – e.g. thermal inertia, albedo, atmospheric opacity – until find best fit to observations • Overall, best fit parameters are consistent with sand-sized soil particles • Remaining mismatches suggest a more complex response to incident solar insolation, due to e.g. sub-surface layering See e.g. Renno/Martinez et al. poster on Tuesday, Hamilton et al. poster on Thursday, Vasavada talk on Friday, and upcoming Hamilton et al. JGR paper
Surface properties [REMS Tground] Observed daily δTgroundand contours of predicted δTground as a function of season and thermal inertia (assuming constant albedo and opacity) 100 95 90 85 80 Daily max-min ground temp (K) 75 70 65 60 0 50 100 150 200 250 300 350 Mission sol See Hamilton et al. poster on Thursday
Atmospheric dust and impact [Mastcam] MSL and Opportunity visible opacities up to ~sol 350 MSL Mastcam opacities are very similar to those at Opportunity, except during e.g. the Ls~208° regional storm Courtesy of Mark Lemmon
Atmospheric dust and impact [REMS pressure] 880 870 860 850 840 830 820 810 800 790 780 770 Big change in shape of daily pressure cycle from sol 96 to sol 97 as a regional dust storm develops near Gale Pressure, Pa sol 96 sol 97 0 4 8 12 16 20 24 Hour, LMST * REMS semi-diurnal pressure tide amplitude Opportunity optical depth THEMIS 9μm optical depth x5 MSL optical depth + In fact, storm onset was first detected via the increased amplitude of the semi-diurnal pressure tide (shown in black) Optical depth Normalized tidal amplitude (%) From Haberle et al. 2013b
Atmospheric dust and impact [REMS, Navcam] Dust devils (dust-filled convective vortices) are thought to be important for ‘background’ dust lifting on Mars Signature of vortex passage in REMS pressure data Vortex incidence around noon (11am-1pm LMST) Courtesy of Henrik Kahanpää From Harri et al., 2013a • REMS has measured dozens of vortices in pressure data • A few may also be associated with small fluctuations in UV • However, NO definitive dust devils have yet been imaged
And many more studies and findings… • SAM atmosphere and rock isotope studies provide insight into past environment in Gale [see earlier Mahaffy et al. talk] • RAD monitoring shows impact of solar cycle and air mass on surface radiation environment [see later Zeitlin et al. talk] • MSL environmental data are helping calibrate present day Mars models & improving their ability to simulate the past • Stay tuned for lots more from MSL’s environmental instruments and investigations!
Firsts for MSL’s environmental investigations • First comprehensive environmental monitoring instrument suite to be landed on the Martian surface • First UV and energetic particle radiation measurements from the surface of Mars • First measurements of sub-surface water abundance and distribution from the surface of Mars • First attempt to measure threshold for particle motion on Mars • Gale Crater is first landing site to provide ability to study the effects of major topography on the environment • First comprehensive 1Hz meteorological dataset for Mars • Also first surface meteorology since Phoenix, and first long-term environmental monitoring since Viking