Download
1 / 53
530 likes | 715 Views
Social Network Analysis. Network Topography. Agenda. SNA Metrics: Overview Network Topography: Overview Provincial-Cosmopolitan Dimension Suicide Garment Industry Broadway Musicals Network Effectiveness Measures: Density, Average Degree & Clustering Coefficient

E N D
Social Network Analysis Network Topography
Agenda • SNA Metrics: Overview • Network Topography: Overview • Provincial-Cosmopolitan Dimension • Suicide • Garment Industry • Broadway Musicals • Network Effectiveness • Measures: Density, Average Degree & Clustering Coefficient • Network Topography: Hierarchical-Heterarchical Dimension • Centralization • Variance • Summary: Network Effectiveness
Agenda • SNA Metrics: Overview • Network Topography: Overview • Provincial-Cosmopolitan Dimension • Suicide • Garment Industry • Broadway Musicals • Network Effectiveness • Measures: Density, Average Degree & Clustering Coefficient • Network Topography: Hierarchical-Heterarchical Dimension • Centralization • Variance • Summary: Network Effectiveness
SNA Metrics Network Topography Centrality, Power and Prestige Cohesive Subgroups Brokers and Bridges
Agenda • SNA Metrics: Overview • Network Topography: Overview • Provincial-Cosmopolitan Dimension • Suicide • Garment Industry • Broadway Musicals • Network Effectiveness • Measures: Density, Average Degree & Clustering Coefficient • Network Topography: Hierarchical-Heterarchical Dimension • Centralization • Variance • Summary: Network Effectiveness
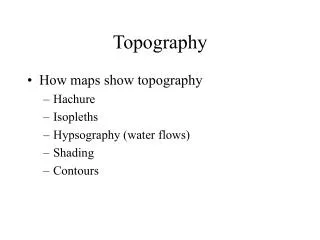
Network Topography: Metrics Network Size Network Density Average Degree Reachability Point Connectivity Average Path Distance Flow Reciprocity (Directed Data) Transitivity Clustering Coefficient E-I Index Hierarchy (Directed Data) Centralization Small World Q Variance
Agenda • SNA Metrics: Overview • Network Topography: Overview • Provincial-Cosmopolitan Dimension • Suicide • Garment Industry • Broadway Musicals • Network Effectiveness • Measures: Density, Average Degree & Clustering Coefficient • Network Topography: Hierarchical-Heterarchical Dimension • Centralization • Variance • Summary: Network Effectiveness
Getting a Job (Granovetter) • Personal contacts (ties) and finding jobs • 19% used formal means • 19% directly applied for a job • 56% used personal contacts • Weak vs. strong (personal) ties • 17% said they saw their contact regularly (strong tie) • 56% said they saw their contact occasionally (weak tie) • 28% said they rarely saw their contact (weak tie) • Personal ties and job satisfaction • Formal means – 76% satisfaction rate • Direct application – 85% satisfaction rate • Personal ties – 91% satisfaction rate
Weak and Strong Ties Actors with numerous weak ties generally find it easier to access information (or other types of resources) from distant parts of the social structure Actors whose with few weak ties are more likely to “confined to the provincial news and views of their close friends” (Granovetter 1983)
Cosmopolitan and Provincial Networks Cosmopolitan Provincial
Weak and Strong Ties • Actors with numerous weak ties generally find it easier to access information (or other types of resources) from distant parts of the social structure • Actors whose with few weak ties are more likely to “confined to the provincial news and views of their close friends” (Granovetter 1983) • There appears to be a curvilinear relationship between density and network effectiveness/performance. Three examples: • Suicide • NY Garment Industry • Broadway Musicals • Implications for Dark Networks?
Agenda • SNA Metrics: Overview • Network Topography: Introduction • Provincial-Cosmopolitan Dimension • Suicide • Garment Industry • Broadway Musicals • Network Effectiveness • Measures: Density, Average Degree & Clustering Coefficient • Network Topography: Hierarchical-Heterarchical Dimension • Centralization • Variance • Summary: Network Effectiveness
Suicide by Network Density Pescosolido and Georgianna 1989:44
Density and Suicide • People embedded in sparse networks often lack the social ties that provide the support that people often need during times of crisis • People embedded in dense networks are often cut-off from people outside of their immediate social group; thus, they often lack the ties to people (e.g., friends and family) who might stop them from taking the final, fatal step
Suicide by Network Density Pescosolido and Georgianna 1989:44
Agenda • SNA Metrics: Overview • Network Topography: Introduction • Provincial-Cosmopolitan Dimension • Suicide • Garment Industry • Broadway Musicals • Network Effectiveness • Measures: Density, Average Degree & Clustering Coefficient • Network Topography: Hierarchical-Heterarchical Dimension • Centralization • Variance • Summary: Network Effectiveness
Garment Industry The firms Uzzi studied tended to divide their market interactions into two types: “market” or “arms-length” relationships (i.e., weak ties) and “special” or “close” relationships (i.e., strong ties), which he refers to as “embedded” ties Embedded ties were especially important in situations where trust was important, where fine-grained information had to be passed to the other party, and when certain types of joint problem-solving were on the agenda (Uzzi 1996:677) On the other hand, Uzzi also found that firms that are too embedded suffer because they cease to have access to information from distant parts of the network, which makes them vulnerable to rapidly changing situations
Garment Industry (Continued) This led Uzzi to argue that firms should seek to maintain a balance of embedded and market ties In support of this he found that the topography of interfirm networks (i.e., in terms of embedded and market ties) varied and that a curvilinear relationship exists between the degree of embeddedness and the probability of firm failure (Uzzi 1996:675-676).
Network Embeddedness and the Probability of Failure Uzzi 1996:692
Agenda • SNA Metrics: Overview • Network Topography: Introduction • Provincial-Cosmopolitan Dimension • Suicide • Garment Industry • Broadway Musicals • Network Effectiveness • Measures: Density, Average Degree & Clustering Coefficient • Network Topography: Hierarchical-Heterarchical Dimension • Centralization • Variance • Summary: Network Effectiveness
Network Density, Global Clustering and Network Performance Uzzi and Spiro (2005) & Uzzi (2008) discovered that in a given year Broadway musicals were more likely to fail when there were high and low levels of network clustering (among the creative teams that produced the musicals) than when there were moderate levels of clustering
Small Worlds and Network Success Uzzi and Spiro 2005:489
Small Worlds and Network Success Uzzi and Spiro 2005:489
Small Worlds and Network Success Uzzi and Spiro 2005:490
Small Worlds and Network Success Uzzi and Spiro 2005:490
Network Density, Global Clustering and Network Performance Uzzi and Spiro (2005) & Uzzi (2008) discovered that in a given year Broadway musicals were more likely to fail when there were high and low levels of network clustering (among the creative teams that produced the musicals) than when there were moderate levels of clustering Why? On the one hand, up to a point connectivity and cohesion (i.e., strong ties) between the various teams that produced the musicals is beneficial because it “increases their access to diverse and novel creative material” circulating within the network On the other hand, very high levels of connectivity and cohesion can lead to homogenization and imitation, reducing the likelihood that teams will innovate and distinguish themselves with exceptional show material
Small World Quotient • How did Uzzi and Spiro test this? • Developed measure which they called the small world quotient (i.e., Small World Q) on which they regressed their dependent variables (critical and financial success) • Independently, Humphries and Gurney (2008) developed the same measure, which they simply called “S” • What is the Small World Q (or S)? • It is based on a model developed by Duncan Watts and Steven Strogatz (1998), which takes a completely ordered network and slowly transforms into a completely random one
Watts-Strogatz Model • By slowly rewiring the completely ordered model, Watts and Strogatz “discovered” three classes of networks • Ordered networks, characterized by high levels of clustering and long (average) path lengths between actors • Random networks, characterized by low levels of clustering and short (average) path lengths between actors • Small world networks, characterized by high levels of clustering and short (average) path lengths between actors • Watts and Strogatz generated numerous networks, calculated the clustering coefficient and average path length for each network, and then “normalized” these measures by dividing them by the clustering coefficient of a random network of the same size (i.e., # of nodes) and density (or average degree) • CC Ratio = Clustering CoefficientActual/Clustering CoefficientRandom • PL Ratio = Path LengthActual/Path LengthRandom
What’s Small World Q? • CC Ratio = Clustering CoefficientActual/Clustering CoefficientRandom • PL Ratio = Path LengthActual/Path LengthRandom • Small World Q = CC Ratio/PL Ratio
Small Worlds and Path Length Generated WS and random networks in sizes ranging from 50 to 1,000, in density ranging from 2 to 20 and rewiring (of WS networks) ranging in probability from .001 to 1.00 More than 110,000 different types of networks Calculated average path length, clustering coefficients, average path length ratios and clustering coefficient ratios for all networks
Small World Q • Small World Q = CC Ratio/PL Ratio • CC Ratio = Clustering CoefficientActual/Clustering CoefficientRandom • PL Ratio = Path LengthActual/Path LengthRandom • Small World Q = Clustering CoefficientActual/Network DensityActual • CC Ratio = Clustering CoefficientActual/Network DensityActual • PL Ratio = 1
Agenda • SNA Metrics: Overview • Network Topography: Introduction • Provincial-Cosmopolitan Dimension • Suicide • Garment Industry • Broadway Musicals • Network Effectiveness • Measures: Density, Average Degree & Clustering Coefficient • Network Topography: Hierarchical-Heterarchical Dimension • Centralization • Variance • Summary: Network Effectiveness
Network Topography and Effectiveness Cosmopolitan Provincial
Network Topography and Effectiveness Efficient Dark Networks Inefficient Dark Networks Inefficient Dark Networks Cosmopolitan Provincial
Network Topography and Effectiveness Efficient Dark Networks Inefficient Dark Networks Inefficient Dark Networks Cosmopolitan Provincial
Agenda • SNA Metrics: Overview • Network Topography: Introduction • Provincial-Cosmopolitan Dimension • Suicide • Garment Industry • Broadway Musicals • Network Effectiveness • Measures: Density, Average Degree & Clustering Coefficient • Network Topography: Hierarchical-Heterarchical Dimension • Centralization • Variance • Summary: Network Effectiveness
Density, Degree and Clustering Network Density = Proportion of Actual Ties to Possible Ties Density tends to decline as network size (i.e., number of nodes) increases This makes it difficult for us to use density to compare networks of different size Average degree is an alternative measure – sum of individual degree scores divided by total number of actors in the network Clustering Coefficient: Density of Alter-network
Agenda • SNA Metrics: Overview • Network Topography: Introduction • Provincial-Cosmopolitan Dimension • Suicide • Garment Industry • Broadway Musicals • Network Effectiveness • Measures: Density, Average Degree & Clustering Coefficient • Network Topography: Hierarchical-Heterarchical Dimension • Centralization • Variance • Summary: Network Effectiveness
Networks (Heterarchies) and Hierarchies Former are seen as decentralized, informal and/or organic types of organizations, while the latter are seen as centralized, formal and/or bureaucratic types (Burns and Stalker 1961; Powell 1990; Ronfeldt and Arquilla 2001) This distinction is useful (and appropriate) in some contexts (see, e.g. Arquilla and Ronfeldt 2001; Castells 1996; Podolny and Page 1998; Powell and Smith-Doerr 1994; Ronfeldt and Arquilla 2001), but within SNA everything is a network, some of which are highly centralized and some of which aren’t (For our purposes) it is probably better to think of these two ideal types as poles on either end of a continuum, running from highly decentralized forms one end to highly centralized ones on the other
Networks (Heterarchies) and Hierarchies • Optimal level • Stark (Mormon Church) – centralization good, but… • “it would be wrong to stress only the hierarchical nature of LDS authority and its authoritarian aspects, for the Latter-day Saints display an amazing degree of amateur participation at all levels of their formal structure. Moreover, this highly authoritarian body also displays extraordinary levels of participatory democracy—to a considerable extent the rank-and-file Saints are the church. A central aspect of this is that among the Latter-day Saints to be a priest is an unpaid, part-time role that all committed males are expected to fulfill” (Stark 2005:125). • AnnaLeeSaxenian (Silicon Valley) • David Tucker (Terrorist Networks)
Network Topography and Effectiveness Heterarchical Hierarchical
Network Topography and Effectiveness Efficient Dark Networks Inefficient Dark Networks Inefficient Dark Networks Heterarchical Hierarchical
Agenda • SNA Metrics: Overview • Network Topography: Introduction • Provincial-Cosmopolitan Dimension • Suicide • Garment Industry • Broadway Musicals • Network Effectiveness • Measures: Density, Average Degree & Clustering Coefficient • Network Topography: Hierarchical-Heterarchical Dimension • Centralization • Variance • Summary: Network Effectiveness
Centralization and Other Measures The larger a centralization index is, the more likely it is that a single actor is very central while the other actors are not, so it can be seen as measuring how unequal the distribution of individual actor values are. Thus, we need to interpret the various indices in terms of the types of centrality estimated. An alternative measure recommended by Hoivik and Gleditsch (1975) and Coleman (1964) is the variance of degree centrality found in a network (Wasserman and Faust 1994:177, 180-181). Finally, if we are working with directed data, then Krackhardt’s (1994) graph theoretical measures of hierarchy can be quite informative. To date, however, most social network analyses of terrorist networks have utilized undirected data