Download
1 / 25
260 likes | 356 Views
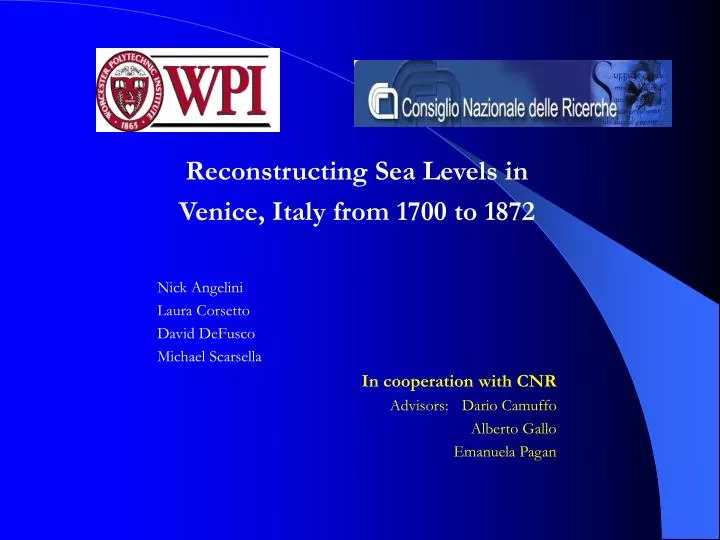
Reconstructing Sea Levels in Venice, Italy from 1700 to 1872 Nick Angelini Laura Corsetto David DeFusco Michael Scarsella In cooperation with CNR Advisors: Dario Camuffo Alberto Gallo Emanuela Pagan. Introduction. Social Implications

E N D
Reconstructing Sea Levels in Venice, Italy from 1700 to 1872 Nick Angelini Laura Corsetto David DeFusco Michael Scarsella In cooperation with CNR Advisors: Dario Camuffo Alberto Gallo Emanuela Pagan
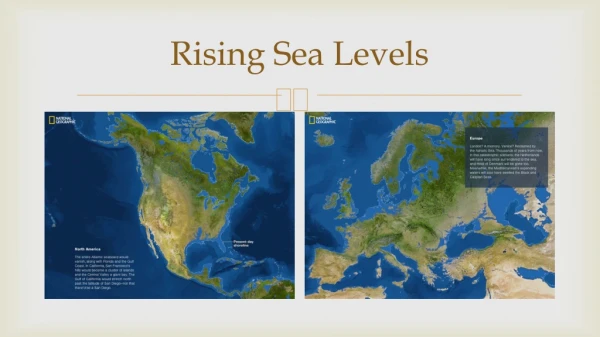
Introduction Social Implications -Tide levels have been rising all over the world for centuries. -The melting of polar ice caps has caused much of this sea level rise 9% area decrease per decade 20% area decrease since 1979 -Industrial revolution effects starting in 1860 *Is the rise in sea level natural, or has man influenced it? Artic cap area decrease since 1979 (NASA)
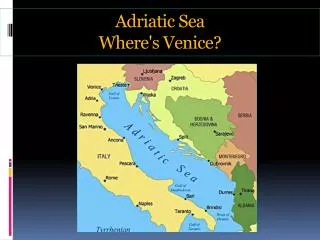
Introduction -The rising rate of the sea level in Venice is unknown from 1700 to 1872. -Gap needs to be filled in order to fully analyze contributing factors behind rising sea levels. -Acqua Alta occurs 20 times per year on average. St. Mark’s square, September, 2001
Mission Statement Using similar photographic analysis methods, accurate paintings will be examined to determine what the sea levels were during the time period of each of the paintings. By applying data collected from paintings, photos, and engravings in canal walls, this project will verify Camuffo’s results and provide a more accurate reconstruction of sea levels in Venice from 1700 to 1872, when automated tide gauges came online.
Approach • Understand background information • Create appropriate methodology • Results and analysis • Conclusion
Background • Selected artists • C markers • Photographs • Dario Camuffo’s results
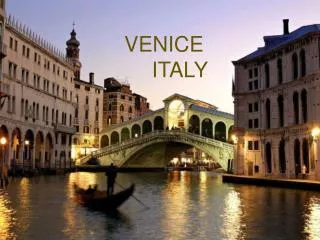
Venetian Artists • Who? When? • Canaletto 1725-1755 • Bellotto 1745-1765 • Guardi 1760-1780 • Why rely on Venetian art? • Accuracy • Camera obscura Antonio Givanni "Canaletto" Canal (1697-1768)
Camera Obscura • Primitive lens system • Extremely accurate for its time • How it works: • Light through lens • Mirror reflects light onto surface • Canvas placed on surface • “Photographic” image created
Camera Obscura • Primitive lens system • Extremely accurate for its time • How it works: • Light through lens • Mirror reflects light onto surface • Canvas placed on surface • “Photographic” image created
Camera Obscura • Primitive lens system • Extremely accurate for its time • How it works: • Light through lens • Mirror reflects light onto surface • Canvas placed on surface • “Photographic” image created
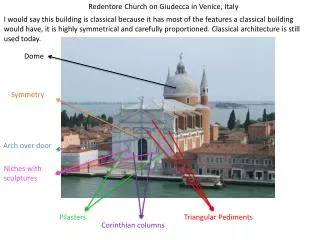
Venetian Paintings • Canaletto’s “Disciples” Belloto and Guardi • Notice algae line • Average high tide level • Comune Marino La Punta Della Dogana (1727)
C markers • C markers • Documents comune marino per year • Etched in stone on canal walls • Many locations unknown (WPI-IQP)
Photographs • Earliest known photos of Venice (mid-1800s) • Will be used in coalition with paintings • More accurate than paintings • Later timeframe for extended dataset
Project Techniques • Reconstruct sea levels • Present-day replication of views • Paintings, Photographs • Waterline differential (height) • Photo measurements vs. on-site measurements • Plot data of average sea level Vs. time (yrs) • Data comparison to global warming statistics • Apply information to or from C-Marker data
Learning from the Past… • Dario Camuffo (CNR) • Originator of sea-level construction concept. • Learn from his work (11 paintings used) • Improve upon his work • Two additional approaches • Photographs • C markers Dario Camuffo of CNR
…Applying toward the Future • Selection of Venetian landscape portraits • Database created • Utilized Catalogue Raisonné • Catagorized appropriately for future use • Date, Image, Source, other info. • Narrowed down by visible Comune Marino line
Digital Reproductions • Map locations of paintings • Obtain copies of photographs • Map locations • Go to locations • Take digital photos of present-day views • Measure to fixed points near and far, in 3 dimensions. • Document Data Map of sea levels and painting locations
Waterline Differential • Record on-site measurement data • Measure same distances within photo/portrait. • Create a ratio (scale) • Distance from comune marino in comparison to today. • Derive Quantitative data • Water level in year of each photo/portrait.
Waterline Differential Cont. • Side-by-side comparison of photos • Obvious comune marino shift • Example shows a 44 cm +/- 10 shift since 1880 • Side-by-Side gives visual confirmation of numeric data Photo Courtesy of Dario Camuffo, 2002
C-Markers • Dated C-Markers checked for support to tide progression trend • If not dated – possible to date with tide information. • Height corresponds to year on tide progression chart. • Markers photographed and documented for database. • Treated as a tertiary source for data if deemed reliable.
Results and Analysis • Create graphical representations of data • Graphs, charts, tables, database • Comparison of data • Global warming • Look for human influences • Pre-recorded tide data since 1872 • Look for correlation
Graphical Representation • Gather relevant data • Height differential • Year of photo/portrait • Plot data points • Tide progression
Data Comparison • Compare tide progression line with global warming data
Comparison to Tidal Data • KEY: Left to Right • Canaletto & Bellotto • Photographs • Tide Gauge data (Blue) • measured sea level since 1872 Courtesy of Dario Camuffo
Conclusion Thank You! • Ultimately aid researchers • Known tidal levels • Two Centuries prior to what is currently known • Comparable to global warming data • Discover human influence on sea level rise • Find a cause for sea level rise since 1700