Download
1 / 20
200 likes | 383 Views
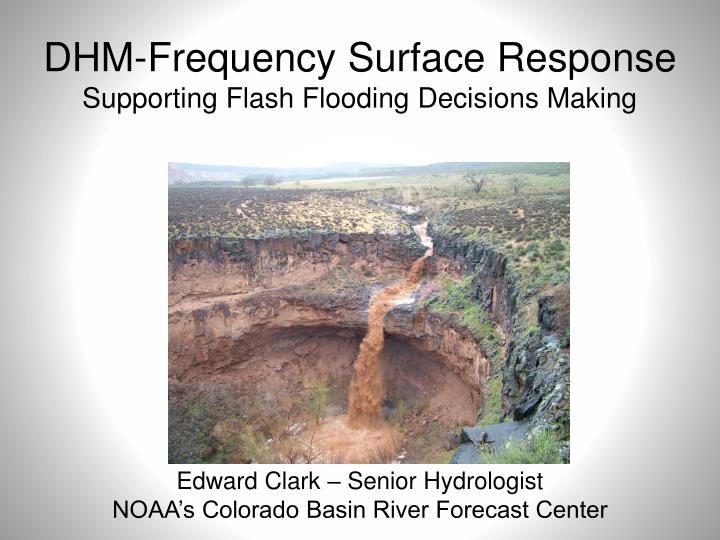
DHM-Frequency Surface Response Supporting Flash Flooding Decisions Making. Edward Clark – Senior Hydrologist NOAA’s Colorado Basin River Forecast Center. Outline. Background and Concept for the Distributed Hydrologic Model – Frequency Surface Response (DHM-FSR) Examples from 2008

E N D
DHM-Frequency Surface Response Supporting Flash Flooding Decisions Making Edward Clark – Senior Hydrologist NOAA’s Colorado Basin River Forecast Center
Outline • Background and Concept for the Distributed Hydrologic Model – Frequency Surface Response (DHM-FSR) • Examples from 2008 • Display and Dissemination methods • Incorporation into the Flash Flood CONOPS and improvements over the existing RFC Flash Flood support.
Background • CBRFC began working with the NWS Distributed Hydrologic Model(s) in 2005 with three main applications/areas: • Incorporation of Distributed Model output time-Series into NWSRFS • Gridded Soil Moisture products. • Flash Flood application – DHM-FSR
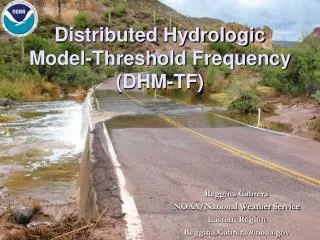
Concept • Run a calibrated version of the National Weather Service (NWS) Hydrology Lab -- Research Distributed Hydrologic Model (HL-RDHM) to model basins response quantified precipitation estimates and forecasts. • Normalize each cell’s discharge (channel flow) and surface flow (non-channelized flow) by comparing it to a historic distribution of hourly values. • Produce and disseminate gridded maps of the normalized response in real-time.
Each modeling element (4-km x 4-km Grid Cell) is characterized by discrete: Soils Data Vegetation Land Cover/Use Slope Aspect Distributed Hydrologic Model Distributed Sacramento Soil Moisture Accounting Model Discharge
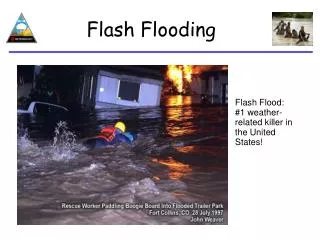
What types of flooding occur within the CBRFC bounds? Sheet Flooding: Defined by HL-RDHM SurfaceFlow Sheet flooding is flooding caused by comparatively shallow water flowing over a wide, relatively flat area which typically does not have the appearance of a well defined watercourse… Channel Flooding : Defined by HL-RDHM Discharge
Communicate the magnitude of the response without the flow/stage relationship that can be developed at a stream gage. Necessary to adjust for the size of the drainage area above the grid cell – response from small streams and large rivers. Make the current grid states meaningful to the forecaster. ? Why a normalization?
Frequency Discharge Modeled Historic Distribution Dec 04 – Mar 05: Large Scale Synoptic Events Each hour’s gridded simulation… 2006 Monsoon season – record flooding 2007 Monsoon season 00z, Jan 1st, 2004 23z, Oct. 31th, 2008 Objectively quantify an events response in relationship to previous responses.
Operational Concept DHM-FSR Post- Processor Non-Exceedance values Critical Threshold Frequency Discharge Or SurfaceFlow Grid of Discharge or Surface Flow “The current discharge is in the top 5% of historical responses…”
Operational Run-times • Run twice each hour: • 15 minutes past – first radar scans • 45 minutes past – initial ALERT gage reports and radar • Initialized with (current – 12-hour) model states • Runs (+) 6-hrs for response to QPE and QPF QPE QPF Model Run -12-hr +6-hr Current Hour
Frequency Discharge Example Discharge Discharge Frequency Non Exceedance Percentage
Frequency Surface Flow Example Surface Flow Surface Flow Frequency Non Exceedence Percentage
Dissemination: CBRFC Webpage Advantages • Utilizes Google Maps imagery for reference. • Portable – relies only on a web browser. • Can display any period of interest (useful for retrospective analysis.) Disadvantages: • Not in the WFO Forecaster’s toolbox. • Need to process xmrg format to geographic ascii grid. • Lag in updating due to conversion and firewall issues.
Dissemination: AWIPS D2D Prototype Gridded Discharge Discharge Frequency MPE Derived 1-hr QPE Surface Flow Frequency
Dissemination: AWIPS D2D Prototype • Disadvantages: • Background images not as robust as Google maps interface. • Limited number of grids ~3-5 days. Advantages: • Familiar tool to the Forecast • Simple conversion from xmrg to grib format (no geographic transform). • Rapid updating (remains within AWIPS.) • Existing loop and query tools.
Supporting the Flash Flood Watch/Warning Process • Not designed to replace FFMP – WFO is still expected to “warn on the rain.” • Identify specific regions of higher impacts. • Answer questions about the duration of flash flooding. • In time, incorporate the short term QPF to better estimate future response.
Cell value time series -- Are Hydrologic Conditions getting better or worse? 1 - frequency Time (hr) 1 - frequency Time (hr)
Enhancements over Existing RFC Flash Flood Products • Incorporates soil, land use, slope and vegetation cover into a calibrated model. • Adds connectivity to route multiple headwater basin cells into downstream cells. • Remembers the carryover in soil moisture states from previous events. • Values are relative to previous response. WFO’s can develop knowledge of their local regional problem areas and set critical non-exceedence values.
Questions Grids: http://www.cbrfc.noaa.gov/gmap/gmap.php Contact: Edward.Clark@noaa.gov