Download
1 / 42
420 likes | 424 Views
Support: JCSDA Grant “Improving analysis of tropical upper ocean conditions for forecasting”. Bias: the unmentionable problem in ocean data assimilation* Jim Carton and Gennady Chepurin (UMD). Bias in ocean data assimilation Two-stage bias correction algorithm SODA GODAS

E N D
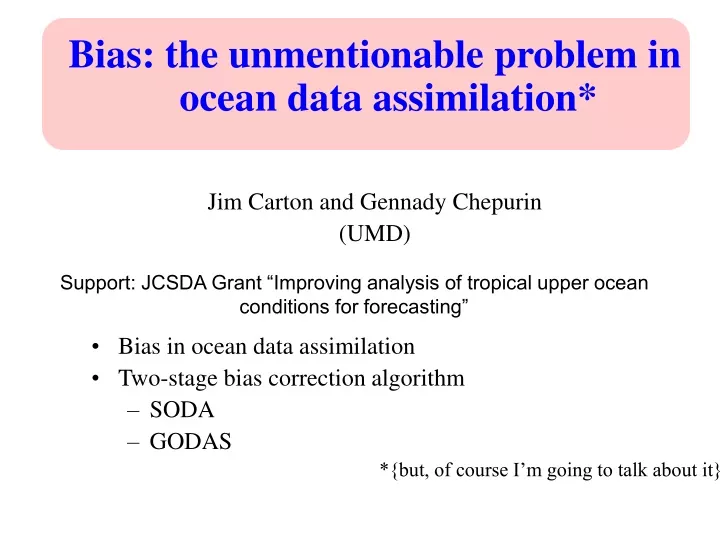
Support: JCSDA Grant “Improving analysis of tropical upper ocean conditions for forecasting” Bias: the unmentionable problem in ocean data assimilation* Jim Carton and Gennady Chepurin (UMD) • Bias in ocean data assimilation • Two-stage bias correction algorithm • SODA • GODAS • *{but, of course I’m going to talk about it}
Bias is the difference between the state forecast and the true state
Forecast Bias Causes • Errors in forcing • Errors in initial conditions/data coverage • Errors in physics parameterizations • Errors in numerics <.> Time-mean Annual harmonic ENSO-related etc.
Bias in the ocean state estimate affects its thermodynamic influence on the atmosphere Climatological SST from ECHO2 coupled model October Cold bias Frey et al., 1997
Bias in ECMWF ENSO forecasts(1987-1999) David B. Stephenson, http://www.met.rdg.ac.uk/home/swr01cac/public_html/talks/bayes3.pdf
SODA grid (actual resolution is 4x)
Gulf Stream in SODA Hydro Observations Sea level
RMS sea level variability Altimeter SODA GFDL
SODA zonal vel. 0N, 140W SODA 10m OBS 50m 100m 150m
SODA meridional vel. 0N, 140W SODA OBS
Time-mean bias along equator “Cold tongue is too cold, while the thermocline in the central basin is too diffuse” 20C
Annual cycle bias in the mixed layer Histogram of In the North Pacific Annual cycle of ML bias amp June Dec phase “The summer mixed layer is too cold, the winter mixed layer is too warm”
D20 Mixed layer T Time-evolution of forecast error along equator “Forecast error is episodic, linked to ENSO” Time
Two stage algorithm to correct systematic aspects of forecast error Stage I Stage II • Alternative approaches: Saha, 1992;Thiebaux and Morone, 1997; DelSole and Hou, 1999; D’Andrea and Vautard, 2000; Griffith and Nichols 1996, 2000 • This follows: Friedland (1969) , Dee and daSilva (1998)
Three-term bias forecast model ENSO-linked bias Annual cycle bias Time-mean bias
along Pacific Eq Correcting time-mean bias 20C This is business as usual This is what results when time-mean bias is modeled 20C
along Pacific Eq Correcting time-mean bias 20C This is business as usual This is what results when time-mean bias is modeled 20C
Corr time-mean bias Correcting time-mean bias
Corr time-mean bias Correcting time-mean bias
Correcting annual cycle bias June Dec Business as usual Annual cycle bias correction
Correcting annual cycle bias June Dec Business as usual Annual cycle bias correction
Annual cycle of forecast error after correction After Before
Correcting ENSO bias CorEOF1,SOI = 0.7 before after
Correcting ENSO bias CorEOF1,SOI = 0.7 before after
Thermocline depth ML temp Summary of the impact of bias correction time mean +annual cycle +ENSO variability RMS (fcst-obs)
Summary • Half of the {forecast – observation} differences in high variability regions are due to bias. The largest contribution is time-mean followed by annual cycle and interannual variability. • Two-stage correction works well in addressing these. Manuscript available: {http://www.atmos.umd.edu/~carton/bias}
NCEP GODAS OGCM Global MOM v.3 Data Assimilation 3D VAR Observations: XBTs TAO P-Floats Altimetry Oceanic I.C.for Coupled Model Analyzed Fields: Temperature Salinity Surface Fluxes: Momentum Heat E - P Statistical Models CCA, Markov ENSO Monitoring From Dave & Jiande
NCEP GODAS products • An ocean reanalysis extending from 1979 through the present has been completed. It is forced by daily fluxes from the NCEP Reanalysis 2 and saved at 5-day intervals. • Operational ocean analyses are forced by daily fluxes from the NCEP GDAS and saved at daily intervals.
Zonal velocity at 0N, 110W SODA GFDL
Temperature – salinity characteristics NCEP may have some problems with AAIW
<Tf – To> {mean} along Equator • Errors in forcing
Developing a cost function for bias analysis Where, e.g. bias estimate {This will need to be coded, but the code follows the current 3D-var code, so won’t be done ‘from scratch’}
Then the state analysis cost function becomes: where: {From a programming point of view all of this is already in place.}
Some conclusions • Explore data set differences • Further algorithm development • Mixed layers • Considerable potential for two-stage bias correction