Download
1 / 45
450 likes | 453 Views
The IPCC report confirms the undeniable reality of global warming and its human-caused origins. This has led to significant changes in climate patterns and is affecting us all. We must take immediate action to prevent further damage. This article discusses the evidence of global warming, its effects on the environment, economy, and human health, as well as the current initiatives and solutions to mitigate its impact.

E N D
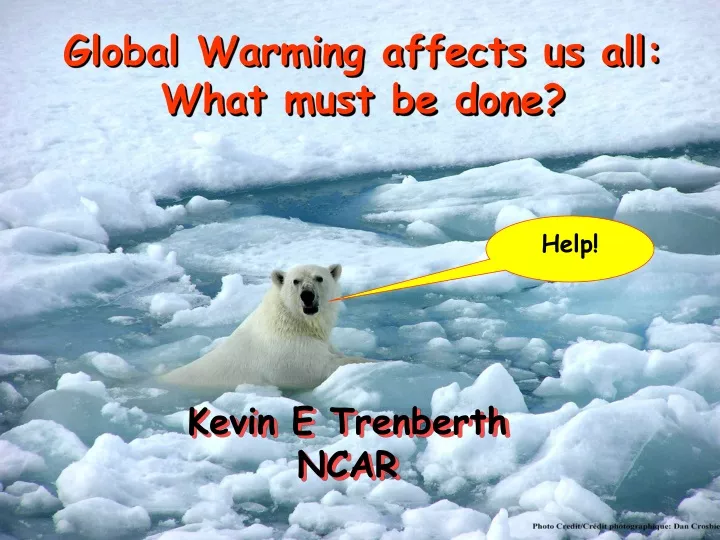
Global Warming affects us all:What must be done? Help! Kevin E Trenberth NCAR
The recent IPCC report has clearly stated that “Warming of the climate system is unequivocal” and it is “very likely” caused by human activities. • Moreover, most of the observed changes are now simulated by climate models over the past 50 years adding confidence to future projections.
Climate The atmosphere is a “global commons.” Air over one place is typically half way round the world a week later, as shown by manned balloon flights. The atmosphere is a dumping ground for all nations for pollution of all sorts. Some lasts a long time and is shared with all.One consequence is global warming!
Changing atmospheric composition: CO2 Mauna Loa, Hawaii Data from Climate Monitoring and Diagnostics Lab., NOAA. Data prior to 1974 from C. Keeling, Scripps Inst. Oceanogr.
CO2 emissions in different regions in 2000 in terms of emissions per capita (height of each block); population (width of each block); and total emissions (product of population and emissions per capita = area of block). Source: M. Grubb, http://www.eia.doe.gov/iea/
Global Warming is unequivocal Since 1970, rise in:Decrease in: • Global surface temperatures NH Snow extent • Tropospheric temperatures Arctic sea ice • Global SSTs, ocean Ts Glaciers • Global sea level Cold temperatures • Water vapor • Rainfall intensity • Precipitation extratropics • Hurricane intensity • Drought • Extreme high temperatures • Heat waves • Ocean acidity
Warmest 13 years: 1998,2005,2003,2002,2004,2006, 2001,2007,1997,1995,1999,1990,2000 25 0.320.09 150 0.080.02 Global mean temperatures are rising faster with time Period Rate Years /decade
Sea level is rising: from ocean expansion and melting glaciers • Since 1992 • Global sea level • has risen 48 mm • (1.9 inches) • 60% from • expansion as ocean temperatures rise, • 40% from melting glaciers • Steve Nerem
Evidence for reality of climate change Glaciers melting Muir Glacier, Alaska 1909 Toboggan Glacier Alaska 2000 1900 2003 Alpine glacier, Austria
Declining Snow Pack in many mountain and continental areas contributes to drought • moreprecipitationfalls as rain rather than snow, especially in the fall and spring. • snow meltoccurs faster and sooner in the spring • snow packis therefore less • soil moistureis less as summer arrives • the risk of droughtincreases substantially in summer • Along with wild fire
Drought is increasing most places Mainly decrease in rain over land in tropics and subtropics, but enhanced by increased atmospheric demand with warming The most important spatial pattern (top) of the monthly Palmer Drought Severity Index (PDSI) for 1900 to 2002. The time series (below) accounts for most of the trend in PDSI. IPCC
Heat waves and wild fires Impacts on human health and mortality, economic impacts, ecosystem and wildlife impacts
Trend plus variability? Heat waves are increasing: an example Extreme Heat Wave Summer 2003 Europe 30,000 deaths IPCC
Natural forcings do not account for observed 20th century warming after 1970 Meehl et al, 2004: J. Climate.
Arctic sea ice disappears in summer by 2050 Already 2007 lowest on record by 22% Abrupt Transitions in Summer Sea Ice • Gradual forcing results in abrupt Sept ice decrease • Extent decreases from 80 to 20% coverage in 10 years. • Relevant factors: • Ice thinning • Arctic heat transport • Albedo feedback 2007 x Holland et al., GRL, 2006
Projected Patterns of Precipitation Change 2090-2100 Combined effects of increased precipitation intensity and more dry days contribute to mean precipitation changes IPCC
Global Warming Actions Prevent Problem Technological Fix Mitigate Adapt No Problem Do Nothing Sustainable Development Future generations Values Precautionary Principle Vested Interests Equity
Mitigation: The UN Framework Convention on Climate Change • Ratified by 189 countries • Ratified by the US • Article 2 is statement of the objective • Convention entered into force 21 March 1994
Kyoto Protocol • A legal instrument under UNFCCC • Requires net reduction in developed country averaged annual GHG emissions of 5% (US 7%) over the period 2008-12 compared to 1990 levels • “Basket” of GHGs (CO2, CH4, N2O, HFCs, PFCs, SF6) • Provisions for “flexible” market mechanisms: international trading system, credits, etc. • 176 countries have ratified • Protocol was ratified; took effect Feb 16, 2005. • US withdrew in 2001.In 2004 US emissions were 16% (20%) over 1990 levels for GHG (CO2).
What about a carbon tax? Anyone can burn stuff and put Carbon Dioxide into the atmosphere as a waste product. If there was a value to Carbon Dioxide then this would presumably be reduced. A carbon tax, carbon emission limits, or pollution fines are designed to create acostfor burning carbon products, like coal and oil. Cap and Trade: Given atarget(such as in the Kyoto Protocol) only so much can be burned andcreditsto allow burning canbe traded(carbon emissions trading). Such a solution can beequitableif implemented across the board. But it can favor those who pollute if a country does not subscribe.
Recent trends: May 2007 Coal fired power stations have been brought on line at a rate of 2 per week over the past 5 years. China leads with one every 3 days or so (560 new plants from 2002 to 2006 and 113 GigaWatts of coal fired power). (200 MW each) Far from decreasing carbon dioxide emissions, the trend is much worse than “business as usual” and higher than A1FI. Raupach et al 2007 PNAS In 2030 global emissions will likely be up by 59% relative to 2004 according to the U.S. Energy Information Administration in its annual International Energy Outlook in May 2007.
Global Warming The Kyoto Protocol basically calls for a freeze on emissions to 1990 levels for developed countries. Similarly, the Montreal Protocol for ozone depletion initially called for a freeze on CFC emissions and only later was this changed to a phase out. A freeze on emissions means that concentrations of carbon dioxide continue to increase.Climate continues to change, temperatures rise and sea level continues to rise.
Global Warming A freeze on emissions means that concentrations of carbon dioxide continue to increase. We can slow global warming down! Disruption arises more from rapid change than from the climate per se. Mitigation effects mainly payoff beyond 2040. So wemustadapt to climate change: we will adapt, whether unplanned (disruptive untold damage and loss of life), autonomously, or planned.
Adaptation to climate change • Assess vulnerability • Devise coping strategies • Determine impacts of possible changes • Plan for future changes Requires information
The climate is changing: It is likely to continue to change! Regardless of the success of mitigation actions: We need a comprehensive information system to: • Observe and track the climate changes and forcings as they occur. • Analyze global products (with models) • Understand the changes and their origins • Validate and improve models • Initialize models; predict future developments • Assess impacts regionally: on environment, human activities and sectors such as agriculture, energy, fisheries, water resources, etc. Such a system will be invaluable regardless of magnitude of global warming T et al 2003
Weather prediction • Weather prediction is a problem of predicting the future evolution of the atmosphere for minutes to days to perhaps 2 weeks ahead. • It begins with observations of the initial state (and their uncertainties) and analyses into global fields, then use of a model of the atmosphere to predict all of the future evolution of the turbulence and eddies for as long as is possible. • Because the atmosphere is a chaotic fluid, small initial uncertainties or model errors grow rapidly in time and make deterministic prediction impossible beyond about 2 weeks.
Climate prediction • Climate prediction is a problem of predicting the patterns or character of weather and the evolution of the entire climate system. • It is often regarded as a “boundary value” problem. For the atmosphere this means determining the systematic departures from normal from the influences from the other parts of the climate system and external forcings (e.g., the sun). • The oceans and ice evolve slowly, providing some predictability on multi-year time scales. • But because there are many possible weather situations for a given climate, it is inherently probabilistic. • Human influences are now the main predictable climate forcing.
Weather and climate prediction • As the time-scale is extended, the influence of anomalous boundary forcings grows to become noteworthy on about seasonal timescales. • The largest signal is El Niño on interannual time scales. • El Niño involves interactions and coupled evolution of the tropical Pacific ocean and global atmosphere. It is therefore an initial value problem for the ocean and atmosphere. • In fact all climate prediction involves initial conditions of the climate system, leading to a seamless (in time) prediction problem.
Seamless Suite of Forecasts Forecast Uncertainty Outlook Years Seasons Guidance Months Threats Assessments 2 Week Forecast Lead Time 1 Week Forecasts Days Watches Hours Warnings & Alert Coordination Minutes Benefits State/Local Planning Energy Health Reservoir Control Space Operation Agriculture Recreation Commerce Ecosystem Flood Mitigation & Navigation Hydropower Protection of Life & Property Environment Fire Weather Transportation Climate Change Boundary Conditions Climate Prediction Weather Prediction Initial Conditions
Progress in NWP and climate modeling There have been no revolutionary changes in weather and climate model design since the 1970s. • Same dynamical equations, with improved numerical methods • Comparable resolution • Similar parameterizations • A modest extension of the included processes And the models are somewhat better. Meanwhile, computing power is up by a factor of amillion. • Model resolution has increased. • Horizontal resolution has quadrupled (at most). • The number of layers has tripled. Factor of • More processes have been introduced. 1000 • Parameterizations have become a little more elaborate. • Longer runs Factorof • More runs: ensembles 1000 Adapted from D. Randall (CSU)
5 Dimensions of Climate Prediction(Tim Palmer, ECMWF) Simulation complexity Data assimilation/ initial value forecasts • Resolution Timescale Ensemble size All require much greater computer resource and more efficient modeling infrastructures
End-to-end Forecast System ………… Forecast 62 4 3 2 1 63 ………… Downscaling 63 62 4 3 2 1 Application model ………… 2 1 63 62 4 3 non-linear transformation 0 0 Probability of Crop yield or disease… Probability of Precip & Temp…
Future needs: A climate information system • Observations: in situ and from space • Data processing and analysis • Data assimilation and model initialization • Better, more complete models • Ensemble predictions: many time scales • Statistical models: applications • Information: regional, sectoral
ImperativeA climate information system • Observations: forcings,atmosphere, ocean, land • Analysis: comprehensive, integrated, products • Assimilation: model based, initialization • Attribution: understanding, causes • Assessment: global, regions, impacts, planning • Predictions: multiple time scales • Decision Making: impacts, adaptation An Integrated Earth System Information System
Climate Information System Trenberth, 2008 WMO Bulletin Nature 6 December 2007
Melting permafrost Major fires Agricultural production at 50%, blowing dust Health warning: Limit outdoor activities; expect brownouts Major fisheries regime change likely Air quality alerts: 75% of days Swimming and Fishing prohibited Frequent flooding and Asian dust threats continue 21 Tropical storms: 10 above normal High danger of toxic CO2 releases Expect fisheries downturn; health threats African bacteria alerts Forecast for 2020 (in 2019)? New environmental forecast products will be feasible Possible Threats for Summer 2020: Drought, hot, dry & unhealthy
What is your carbon footprint? • You will be affected by climate change (you are already) • You will be affected by legislation designed to address climate change (whether good or bad)
The Challenge: Sustainable Management of an Ever-Changing Planet