Download
1 / 20
200 likes | 302 Views
I mpact of demographic change Mary REDEI, D.Sc. HU Regional Informatics Ltd. ADAPT2D C Transnational Study tour Budapest, 20-22. May 2014. Demography left the descriptive style. Foresight : t he future of the past based on relationship, explanation, how the structure limits the flow?

E N D
Impact of demographic changeMary REDEI, D.Sc.HURegionalInformatics Ltd.ADAPT2DC Transnational Study tour Budapest, 20-22. May 2014
Demography left the descriptive style • Foresight: the future of the past based on relationship, explanation, how the structure limits the flow? • Border of demography extended like: economical activity, graduation, ethnicity, religious, household.. • If theprocess of demography is in harmony, not much attentionfollows, pro-action… • But now, decreasing, ageing, no natural reproduction, rising mobility. • Why are theseproblems? How can we benefit?
Main pop trends • No natural reproduction. Half of 35y girls have no child! Under replacement level, life expectancies slowly rising, but still… • Demographic behaviour rapidly changing, vulnerability of life. • Cohort size varied from220 to 85 thousands/y, (old) dependency ratio is growing, young 0,23 old 0,39 (0,85!) these are challenges for institutional utilisation, propagative number limits the expectation. • See the evolution of age tree.
Replacementmovement • 300 immigrants + 200 staying permit holders, 600 working +50 studying abroad +illegal, seasonal and circular migrants. 12% of working age. • Without immigration the population decrease would have been more rapid. 200 had got Hungarian citizenship and live here. Two-thirds of them live near thecapital. • The small territorial level’s centrums are 4 times attractivecomparedtotheir periphery. Better educated, younger people. External HR resources – new task their re-engineering. • MrMax Fischer:‚we called workers and human arrived.’ Migration extended from worker to family. • Freemovement is notequaltofree access to social services
Ageing • Raising awareness of inhabitants, common and individual responsibility. • Living longer in health, living away, growing generation age-distance→1990. Around age of 20y to give birth to first child, nowadays it is over 30y. • Micro spatial distribution: living alone 32%, from this old household 53%. • Macro spatial distribution: access to oversized infrastructure, citizen right versa Constitution, how the service companies should be ready to do so? Profit or gratis? Who will compensate?
Spatialdistribution • Rural: farmers aging, how to cultivate the land? Revitalization of life on economical basis or social ones? PC illiteracy and E-governance? • City: low mobility level, specially old people, high maintenance cost, more and different institutional placement expected on XXI century level. • Suburban area: early ´90 started without city governance, orientation. Particular way –local bargain, eg.35 y→60y, no physical -mental interest and effort to enjoy the green. No big family, real estate supply! • Border area: isolation →CBC, real estate boom, two ways flow, interactive contact zone, speciallytoCroatia, Ukraine, Slovakia.
Double globaleffects • from 2008 Schengen free flow area, and economical-financial crisis, • The western demographic behaviours spread versus the eastern structure. Fertility, causes of deaths. • Silver economy +elderly immigration to Hungary. Former Romanian emigrants gained Austrian citizenship and return to ethnic life.
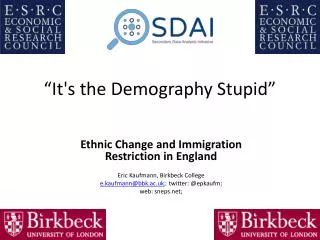
Half of population lives in red lane Three national borders3X3 structure
Productivity of individuals in a closed economy and in a market economy • Underinvest to accumulate intellectual capital during socialism. • FDI was able to recruit eligible HR from labour-market, but in 1993 opened job fairs, direct from universities. • Recently, over 30y by proven experience in CV, despite of having a residence and job they moved to abroad for carrier, for better life style, be cosmopolitan, take a chance…
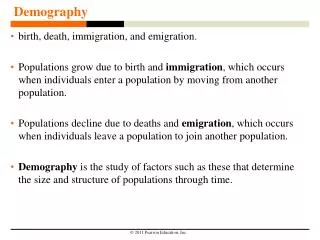
Népesség százalékos változása településenként, 2041 (2011. október 1. népesség=100%)
Build environment • Social and technical infrastructure↔ citizen right/severely disabled • Housing structure: expanded, but not appropriate to their age. • Internal mobility:permanent flow from East to West, South to Nord. 1950-60: activity modification from agriculture to industry, concentratedtoBudapest. 1960-75:housing and employment motivation, state construction. 1975-90: urban network extension, block of houses and private construction on perspectives. 1992-2007:employment to urban + suburban, no state investmentinhousing. 2008-beyond the border. • new partnership had formed in housing in western border area. Eg.: car assembly company (e.g.: AUDI) +newly internal mobile worker ( Mr XY) +property owner (landlord) • Emigrationcreats depopulated settlements.
Economicalimpact • IMF: social and regional disparities limit the sustainable development. • Biological gain and loss. No social load in sending case. • Human development: graduation, skill, ability experience • Livinglonger→ late start and life events shift • Immigrants pay more tax than their social claim, • Tax paying foreigners 7% in capital, 3% other counties, loss from emigration, • remittances received (2,3 b$)1,8% GDP 42. ranked, sent (1,1 b$) 0,9 % GDP 36. ranked. • Missing thetax payersthereforemissingtax, the production is not here!
Somequestion and re-mark • Separate the pro-action policy from the re-action policy, for example early warning system. • Increase and strengthen the capability to affiliate based on mutually agreements, • How can we expect solution from an inflexible system? • Who will compensate the difference and whether on economical or on social basis action?
Thanks for your attention and remarks redeymari@gmail.com