Download
1 / 28
280 likes | 474 Views
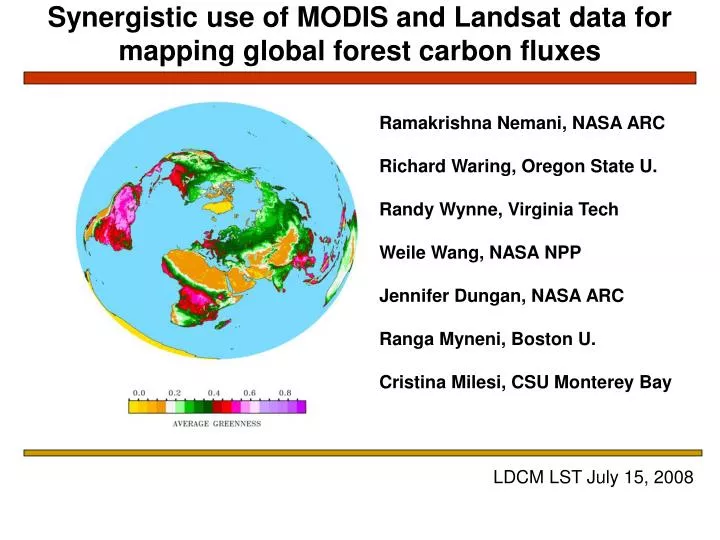
Synergistic use of MODIS and Landsat data for mapping global forest carbon fluxes. Ramakrishna Nemani, NASA ARC Richard Waring, Oregon State U. Randy Wynne, Virginia Tech Weile Wang, NASA NPP Jennifer Dungan, NASA ARC Ranga Myneni, Boston U. Cristina Milesi, CSU Monterey Bay.

E N D
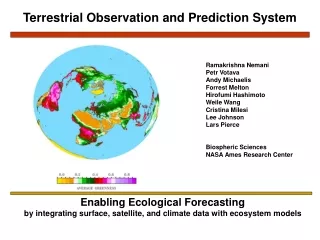
Synergistic use of MODIS and Landsat data for mapping global forest carbon fluxes Ramakrishna Nemani, NASA ARC Richard Waring, Oregon State U. Randy Wynne, Virginia Tech Weile Wang, NASA NPP Jennifer Dungan, NASA ARC Ranga Myneni, Boston U. Cristina Milesi, CSU Monterey Bay LDCM LST July 15, 2008
outline • Integration of satellite data with modeling • Description of the Terrestrial Observation and • Prediction System (TOPS) • A brief review of current TOPS applications • Potential for integrating Landsat data • 2. Mapping global forest carbon fluxes • Motivation • Approach • Key assumptions • Prototype activities • Global mapping with Google academic computing
A data-Modeling framework Monitoring Modeling Forecasting Multiple scales Predictions are based on changes in biogeochemical cycles Nemani et al., 2003, EOM White & Nemani, 2004, CJRS
Fluxnet Weather network Access to a variety of observing networks Soil moisture network Streamflow network
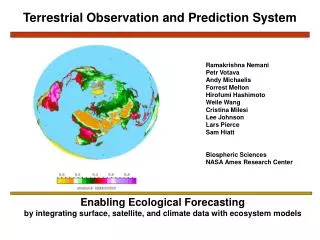
Access to a variety of remote sensing platforms Integration across Platforms, Sensors, Products, DAACs ..Non-trivial
Ability to integrate a variety of models Biogeochemical Cycling Crop growth/yield Pest/Disease Global carbon cycle Prognostic/diagnostic models
Ability to work across different time and space scales Hours Decades Continental Carbon Balance Vineyard water balance
TMAX TMIN VPD PRECIP SRAD Gridded Weather Surfaces for California using nearly 700 weather stations daily Weather networks often operated by different govt. agencies and/or private industry. Rarely integrated because they are intended for different audiences. We specialize in bringing them together to provide spatially continuous data. maps come with cross-validation statistics
Daily satellite mapping of CA landscapes SNOW COVER VEGETATION DENSITY VEGETATION PHENOLOGY FIRE
California : Ecological Daily Nowcast at 1km [Feb/01/2006] Climate + Satellite Carbon and water cycles T P GPP ET 0 5 2.5 GPP (gC/m2/d) ET (mm/d) Biome-BGC Simulation models RAD Outputs include plant growth, irrigation demand, streamflow
Daily Nowcasts: California Ecosystem Vegetation Hydrology Meteorology
Weekly Ecocasts: California Current Data Historical Data Anomaly Detection
Using TOPS Data to Identify Drivers of Mosquito Abundance and Virus Transmission Risk in California and western U.S. Correlations between temperatures and mosquito abundance in CA These relationships are being used to develop predictive models.
TOPS products for NOAA Fisheries: Forecasting Stream Temperature for Anadromous Fisheries Management TOPS data and regional climate models will drive forecasts of steam temperature developed by NOAA Fisheries. Forecasts will be used in decision making related to water releases for management of habitat for endangered fish species.
Irrigation Forecasts Irrigation Forecast for week of July 19-26, 2005 Tokalon Vineyard, Oakville, CA CIMIS Measured Weather Data through July 18, 2005 NWS Forecast Weather Data July 19-26, 2005 0 30 Forecast Irrigation (mm) 0 meters 1000 N Fully automated web delivery to growers
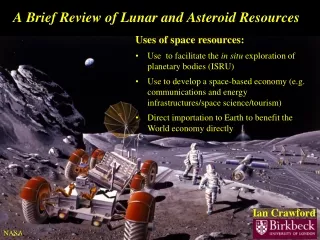
Mapping global forest carbon fluxes Moving from pools to fluxes Flux towers shedding light on carbon cycling MODIS algorithms Availability of global Landsat data Access to computing resources Strong interest from Google Earth Motivation
Education vs Science • Not to convince scientists • Mainly to educate the public • about climate change & Kyoto • protocol • Great to show we can do it at 30m • globally
Assumptions • Leaf Area Index can be used to scale carbon fluxes • such as Gross Primary Production (GPP) • Ratio between GPP and NEP (Net Ecosystem • Production) is fairly constant for mature stands • We can rely on remote sensing to map recent • disturbances that deviate from a constant • NEP/GPP ratio
Climate and LAI interactions captured by BIOME-BGC Relation between LAI and GPP depends on the climate Standard MODIS LAI and GPP products are available at 1km Landsat data have been widely used to estimate LAI (NDVI, SR, RSR)
Fluxnet data are useful in simplifying carbon cycling NEP/GPP ratio appears to be conservative, 0.25-0.30 for mature stands. Recently disturbed sites deviate from this, and are often large C sources (-0.8). If we know, land cover, LAI and climate, GPP is relatively easy to estimate, Standard MODIS GPP algorithm does this globally at 1km.
Mapping LAI from Thematic Mapper NDVIm Leaf Area Index
NDVI\NDVIm Leaf Area Index Ability to map recent disturbances Disturbances
Global Mapping • Google Academic Computing • 1000 clusters, over 30,000 CPUs • Over 100 Pb of storage • A new layer on Google Earth
Summary Exciting opportunities for integrating Landsat data into operational DSS Lot of interest from private sector We may have resources to routinely process global Landsat data sets Collaboration with Google Earth opens new opportunities for validation