Download
1 / 18
190 likes | 338 Views
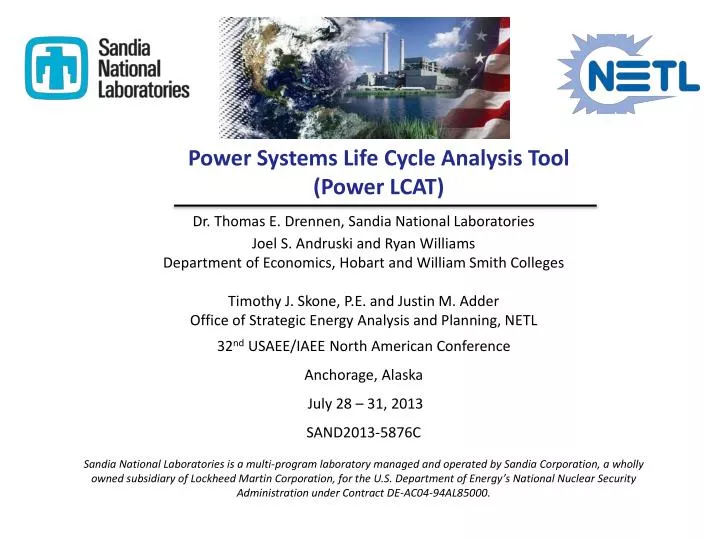
Power Systems Life Cycle Analysis Tool (Power LCAT). Dr. Thomas E. Drennen, Sandia National Laboratories Joel S. Andruski and Ryan Williams Department of Economics, Hobart and William Smith Colleges Timothy J. Skone, P.E. and Justin M. Adder

E N D
Power Systems Life Cycle Analysis Tool (Power LCAT) Dr. Thomas E. Drennen, Sandia National Laboratories Joel S. Andruski and Ryan Williams Department of Economics, Hobart and William Smith Colleges Timothy J. Skone, P.E. and Justin M. Adder Office of Strategic Energy Analysis and Planning, NETL 32nd USAEE/IAEE North American Conference Anchorage, Alaska July 28 – 31, 2013 SAND2013-5876C Sandia National Laboratories is a multi-program laboratory managed and operated by Sandia Corporation, a wholly owned subsidiary of Lockheed Martin Corporation, for the U.S. Department of Energy’s National Nuclear Security Administration under Contract DE-AC04-94AL85000.
Introduction • The Power Systems Life Cycle Analysis Tool (Power LCAT) is a Department of Energy-funded collaboration between the National Energy Technology Laboratory (NETL) and Sandia National Laboratories (SNL). • This high-level, dynamic model calculates production costs and tracks environmental performance—providing users with the total amount of greenhouse gases created at each of five stages of the technology’s life—for a range of electricity generation technologies. • Policy makers, students, and stakeholders can use this tool to consider the entire life cycle of an energy technology, from raw materials acquisition to final product transport. • This intuitive tool includes four main sections: • The “Production Analysis” section calculates the cost of electricity (in $/kWh) for each option and allows users to explore key sensitivities. • The “Environmental Performance” section estimates aggregate greenhouse gas and non-greenhouse gas emissions, as well as water usage at each stage in the life cycle of electricity production. • The “Costs vs. Emissions” section explores the tradeoffs between costs (in $/kWh) and greenhouse gas emissions (in kg CO2 equivalent/MWh). • The “Sensitivity Analysis” section of Power LCAT allows variation of several assumptions—such as capital costs, operations and fuel costs, interest rates, efficiency, and capacity factors—simultaneously while providing graphical representation of the result. • Power LCAT provides users with a clear understanding of the economic and environmental tradeoffs associated with various electricity production options. 1
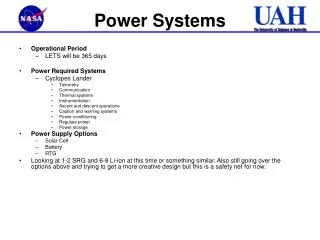
Power LCAT Technologies • The technology options are based on detailed life cycle analysis reports conducted by NETL and include: • Natural Gas Combined Cycle (NGCC), • Integrated Gasification Combined Cycle (IGCC), • Supercritical Pulverized Coal (SCPC), • Existing Pulverized Coal (EXPC), • Existing (EXNUC) and new Nuclear (Gen III Plus), and • Onshore Wind (with and without backup power). • The goal of the NETL studies are to compare existing and future technology options using a life cycle analysis (LCA) which include: • Raw Material Acquisition • Raw Material Transport • Energy Conversion Facility • Product Transport • End Use • All of the fossil fuel technologies also include an option for including carbon capture and sequestration technologies (CCS). 2
Production Analysis This section calculates the cost of electricity (in $/kWh) for each option and allows users to explore key sensitivities. Color-coded cost components allow for quick understanding of key sensitivities. 3
Production Analysis At current natural gas prices ($3.68/MMBtu; 7/10/13), NGCC plants are the least cost option. Uncertainty bars show the possible variation based on user-defined uncertainties. 4
Production Analysis The Financial Assumptions Screen allows user to vary financial parameters, including debt/equity financing rates, federal and state taxes, depreciation, construction time, CO2 taxes, and plant life. 5
Production Analysis This example illustrates the effect of CO2 taxes on the relative economics. A $55/tCO2 tax makes SCPC with CCS cost competitive with SCPC without CCS. 6
Environmental Performance This section tracks the life cycle emissions of key greenhouse gases (GHG), other pollutants, and water withdrawals and consumption. 7
Environmental Performance Along with GHG emissions, this section gives static emissions metrics for several other environmental factors on a life cycle basis: Pb, Hg, NH3, CO, NOx, SOx, VOC, PM, and H2O (withdrawals and consumption). 8
Environmental Performance The Energy Conversion Facility Greenhouse Gases screen compares GHG emissions from the plant (ECF stage) against a specified benchmark. 9
Costs vs Emissions This section explores the tradeoffs between production costs ($/kWh) and Life Cycle (LC) GHG performance (kg CO2e/MWh). 10
Costs vs Emissions Adding carbon capture and storage (CCS) to an EXPC plant lowers the emissions, but increases the costs. Costs and emissions are now comparable to a new NGCC plant without CCS. 11
Sensitivity Analysis This section allows one to vary several assumptions simultaneously. Parameters are varied by cost category. Tornado plot shows sensitivity by cost category. Table displays cumulative cost range. 12
Sensitivity Analysis The Break-Even Analysis option makes it possible to find cost assumption points at which technologies are cost competitive. For example, capital costs below $2,500 $/kW would allow a new nuclear plant to compete economically with a new super critical coal plant (SCPC). 13
Results • For the default model assumptions, the results show that: • For the fossil fuel technology options the supercritical pulverized coal plant is the lowest cost option at 6.01 cents/kWh. • The next lowest cost fossil fuel option is the natural gas combined cycle plant (6.52 cents/kWh) and then the integrated gasification combined cycle plant (7.90 cents/kWh). At current market prices, the NGCC plant becomes the low cost option (4.28 cents/kWh for natural gas price at 3.68 $/MMBtu). • While existing nuclear plants produce power at very low cost (1.74 cents/kWh), power from a new Gen III+ nuclear plant would be more expensive than the fossil-fuel alternatives (10.78 cents/kWh). • Power LCAT currently includes one renewable technology option – a 2 MW wind turbine with a gas turbine simple cycle backup (8.11 cents/kWh) and without natural gas plant backup (4.91 cents/kWh). 14
Conclusion • The Power LCAT is a high-level dynamic model that calculates production costs and tracks environmental performance for a range of electricity generation technologies: • natural gas combined cycle (NGCC), • integrated gasification combined cycle (IGCC), • supercritical pulverized coal (SCPC), • existing pulverized coal (EXPC), • existing (EXNUC) and new nuclear (Gen III Plus), and • onshore wind (with and without backup power). • All of the fossil fuel technologies also include an option for including carbon capture and sequestration technologies (CCS). • The model allows for quick sensitivity analysis on key technical and financial assumptions, such as: capital, O&M, and fuel costs; interest rates; construction time; heat rates; taxes; depreciation; and capacity factors. • Power LCAT is targeted at helping policy makers, students, and interested stakeholders understand the economic and environmental tradeoffs associated with various electricity production options. 15
Model Availability Power Systems Life Cycle Analysis Tool (Power LCAT) is available on the NETL website: NETL Energy Analysis Models and Tools http://www.netl.doe.gov/energy-analyses/refshelf/PubDetails.aspx?Action=View&Source=Main&PubId=429 16
Contact Information NETL SNL www.netl.doe.gov www.sandia.gov Timothy J. Skone, P.E. Lead Physical Engineer OSEAP - Planning Team (412) 386-4495 timothy.skone@netl.doe.gov Justin M. Adder Economist OSEAP - Planning Team (412) 386-7309 justin.adder@netl.doe.gov Dr. Thomas E. Drennen Senior Economist, SNL Professor of Economics, HWS Colleges (315) 781-3419 drennen@hws.edu 17