Download
1 / 56
560 likes | 689 Views
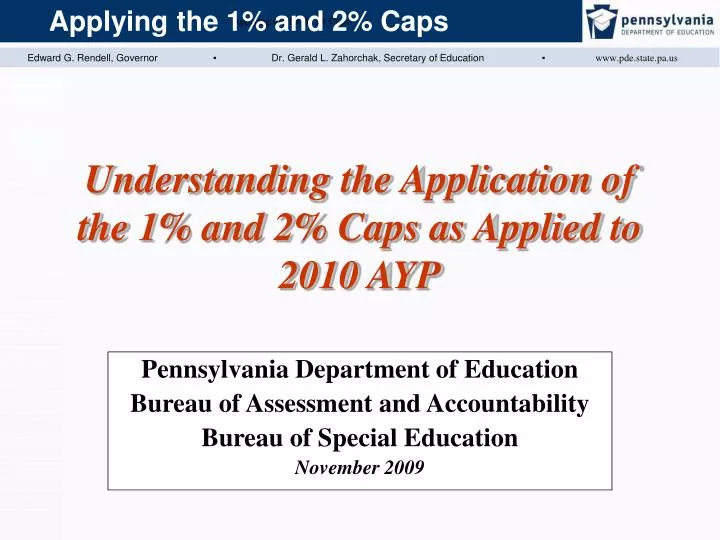
Understanding the Application of the 1% and 2% Caps as Applied to 2010 AYP. Pennsylvania Department of Education Bureau of Assessment and Accountability Bureau of Special Education November 2009. March 19 – 26, 2010 (Tentative) PIMS/AYP Training April 7 – May 6, 2010 PIMS Snapshot

E N D
Understanding the Application of the 1% and 2% Caps as Applied to 2010 AYP Pennsylvania Department of Education Bureau of Assessment and Accountability Bureau of Special Education November 2009
March 19 – 26, 2010 (Tentative) PIMS/AYP Training April 7 – May 6, 2010 PIMS Snapshot April 7 – May 7, 2010 PSSA & PSSA-M Testing Window May 14, 2010 Deadline for testing materials to arrive at DRC Important Dates
No Child Left Behind Act of 2001 All students must be Proficient or higher in mathematics and reading/language arts by 2014. To ensure that districts/schools are on track to achieve this goal, states determine if districts/schools are making sufficient progress each year; i.e. Adequate Yearly Progress No Child Left Behind
Participation in the state math assessment Participation in the state reading assessment Performance on the state math assessment Performance on the state reading assessment Other academic indicators AYP Targets
Participation in the state math assessment Participation in the state reading assessment Performance on the state math assessment Performance on the state reading assessment Other academic indicators AYP Targets
Performance and participation are calculated differently for schools and districts Schools Performance and participation Tested population in the school Districts Performance and participation Tested population in a grade span AYP Review
Percentage of students Advanced/Proficient Percentage of students Advanced/Proficient with a confidence interval Percentage of students over two years Advanced/Proficient Percentage of students over two years Advanced/Proficient with a confidence interval Safe Harbor Safe Harbor with a confidence interval Growth Model Performance
The Pennsylvania Alternate System of Assessment (PASA) is administered to the most severely, cognitively disabled students. Though many believe that the PASA cannot be administered to more than one percent of its total population, this belief is incorrect. The PASA may be administered to as many students who meet the six criteria; however, when calculating AYP, no more than 1% of an LEA’s Advanced/Proficient scores counted as proficient for AYP may come from PASA results. 1% Cap
“The 1.0 percent cap (calculated at the State and LEA levels) is a limit on the number of proficient or advanced scores based on alternate achievement standards that may count as proficient or advanced for AYP purposes. The following example illustrates the implications for an LEA where more than 1.0 percent of its students score proficient on an alternate assessment based on alternate achievement standards. 1% Cap
The 1.0 percent cap requires that an LEA with 10,000 students in the grades assessed may count for AYP purposes the scores of no more than 100 students scoring as proficient on an alternate assessment based on alternate achievement standards. If 150 students in this LEA score proficient or advanced on an alternate assessment based on alternate achievement standards, the LEA must: 1) Determine which 50 proficient scores will be considered not proficient, and 2) Count these excess 50 scores as not proficient in each subgroup that each student is in (e.g., all students, a racial/ethnic group, and students with disabilities). “ 1% Cap
Grade span All Students White Non-Hispanic IEP Economically Disadvantaged 1% Cap
Grade span All Students White Non-Hispanic IEP Economically Disadvantaged ABC Elementary School All Students White Non-Hispanic IEP Economically Disadvantaged 1% Cap
Under the final regulations on modified academic achievement standards, when measuring AYP, States and LEAs have the flexibility to count - - in determining AYP - -the proficient and advanced scores of students who take alternate assessments based on modified academic achievement standards - - so long as the number of those proficient and advanced scores does not exceed 2.0 percent of all students in the grades assessed . . . 2% Cap
The 2.0 percent cap requires that an LEA with 10,000 students in the grades assessed may count for AYP purposes the scores of no more than 200 students scoring proficient or advanced on an alternate assessment based on modified academic achievement standards. If 250 students in this LEA score proficient or advanced on an alternate assessment based on modified academic achievement standards (and the LEA reached the 1.0 percent cap on alternate assessments based on alternate academic achievement standards), the LEA must: 2% Cap
Determine which 50 proficient and advanced scores will be considered not proficient, and Count these excess 50 scores as not proficient in each subgroup that each student is in (e.g., all students, a racial/ethnic group, and students with disabilities) at the school, LEA and SEA levels. 2% Cap
The 2.0 percent cap requires that an LEA with 10,000 students in the grades assessed may count for AYP purposes the scores of no more than 200 students scoring proficient or advanced on an alternate assessment based on modified academic achievement standards. If 250 students in this LEA score proficient or advanced on an alternate assessment based on modified academic achievement standards (and the LEA reached the 1.0 percent cap on alternate assessments based on alternate academic achievement standards), the LEA must: 2% Cap
Percentage of students Advanced/Proficient Percentage of students Advanced/Proficient with a confidence interval Percentage of students over two years Advanced/Proficient Percentage of students over two years Advanced/Proficient with a confidence interval Safe Harbor Safe Harbor with a confidence interval Growth Model Performance
Percentage of students Advanced/Proficient 1,000 students enrolled for full academic year and received a score 750 Advanced/Proficient 750 ÷ 1,000 = 75% Performance
Mathematics 2002-2004 35% 2005-2007 45% 2008-2010 56% 2011 67% 2012 78% 2013 89% 2014 100% Reading 2002-2004 45% 2005-2007 54% 2008-2010 63% 2011 72% 2012 81% 2013 91% 2014 100% Performance Targets
Confidence intervals take into account the fact that the students tested in any particular year might not be representative of students in that school across the years. Confidence intervals control for this sampling error or variation across years to account for schools or subgroups that come very close to achieving their annual thresholds, thus meeting their specific AYP Targets. The United States Department of Education approved a 95% Confidence Interval (C.I.) in Pennsylvania for AYP performance calculations. Performance via a Confidence Interval
2 Year calculation 2010 38 out of 70 2009 39 out of 65 Total (2 year calculation) (38 + 39) = 77 proficient or higher out of (70 + 65) = 135 students 77 ÷ 135 = 57% Performance via 2 year uniform averaging
3 year calculation can only be used with very small schools where less than 40 students in a two year time period are assessed in the entire building. Performance via 3 year calculation
Confidence intervals take into account the fact that the students tested in any particular year might not be representative of students in that school across the years. Confidence intervals control for this sampling error or variation across years to account for schools or subgroups that come very close to achieving their annual thresholds, thus meeting their specific AYP Targets. The United States Department of Education approved a 95% Confidence Interval (C.I.) in Pennsylvania for AYP performance calculations. Performance via a Confidence Interval
A 10% reduction in the percent of students NOT proficient 2008 results 30% Advanced and Proficient 70% below Proficient 10% of 70% = 7% 70% - 7% = 63% 2009 Safe Harbor Target is 63% or less below Proficient OR 37% or greater Proficient and Advanced Performance via Safe Harbor
A 75% confidence interval on the safe harbor calculation Performance via Safe Harbor with a confidence interval
Purpose of the Growth Model Provision Recognize the efforts of schools whose students have not achieved proficiency but are on trajectories towards proficiency on future PSSA exams.
Calculating the Percent Proficient by Projections • Actual PSSA scores are used when there are not sufficient data to calculate projected score for a particular student • Actual Assigned PASA scores are always used • Actual Assigned PSSA-M scores are always used.
The Proxy was ‘in place of’ the PSSA-M. The Proxy is no longer used. Special Performance calculation – the Proxy
Special Education/IEP students Students with an IEP who are enrolled in a district and are receiving educational services from their district of residence are attributed to their school of residence, their district of residence, and the state. Students with an IEP who are enrolled in a charter school and are receiving educational services from their charter school are attributed to their charter school and the state. Attribution
Special Education/IEP students Students with an IEP who are enrolled in a district and are receiving educational services from an entity other than their district of residence are attributed to their district of residence and the state. Students with an IEP who are enrolled in a charter school and are receiving educational services from an entity other than their charter school are attributed to their charter school and the state Students with an IEP who are enrolled in a district and are placed into an APS are attributed to their district of residence and the state Students with an IEP who are enrolled in a charter school and are placed into an APS are attributed to their charter school and the state Attribution
Special Education/IEP students Students who are court or agency placed are attributed to the state Students with an IEP who are enrolled in a district and are placed into an Alternative Education for Disruptive Youth Program are attributed to their school of residence, their district of residence, and the state Students with an IEP who are enrolled in a charter school and are placed into an Alternative Education for Disruptive Youth Program are attributed to their charter school and the state Attribution
Charter schools and full-time comprehensive CTC’s are calculated as schools, not districts. AYP Review
The 1% PASA cap is based on 450 students 1% of 450 = 4.5 We always round up, so no more than 5 Advanced/Proficient scores used for AYP can come from the PASA The 2% PSSA-M cap is based on 400 students The 50 3rd grade students aren’t included 2% of 400 = 8 1% and 2% Caps