Download

1 / 38
380 likes | 498 Views
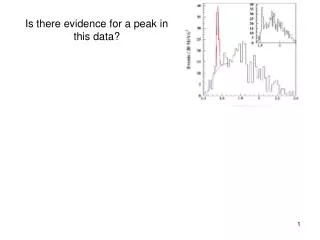
. Is there evidence for a peak in this data?. Is there evidence for a peak in this data?. “Observation of an Exotic S=+1 Baryon in Exclusive Photoproduction from the Deuteron” S. Stepanyan et al, CLAS Collab, Phys.Rev.Lett. 91 (2003) 252001

E N D
Is there evidence for a peak in this data? “Observation of an Exotic S=+1 Baryon in Exclusive Photoproduction from the Deuteron” S. Stepanyan et al, CLAS Collab, Phys.Rev.Lett. 91 (2003) 252001 “The statistical significance of the peak is 5.2 ± 0.6 σ”
Is there evidence for a peak in this data? “Observation of an Exotic S=+1 Baryon in Exclusive Photoproduction from the Deuteron” S. Stepanyan et al, CLAS Collab, Phys.Rev.Lett. 91 (2003) 252001 “The statistical significance of the peak is 5.2 ± 0.6 σ” “A Bayesian analysis of pentaquark signals from CLAS data” D. G. Ireland et al, CLAS Collab, Phys. Rev. Lett. 100, 052001 (2008) “The ln(RE) value for g2a (-0.408) indicates weak evidencein favour of the data model without a peak in thespectrum.” Comment on “Bayesian Analysis of Pentaquark Signals from CLAS Data” Bob Cousins, http://arxiv.org/abs/0807.1330
PARADOX Histogram with 100 bins Fit 1 parameter Smin: χ2 with NDF = 99 (Expected χ2 = 99 ± 14) For our data, Smin(p0) = 90 Is p1 acceptable if S(p1) = 115? • YES. Very acceptable χ2 probability • NO. σp from S(p0 +σp) = Smin +1 = 91 But S(p1) – S(p0) = 25 So p1 is 5σ away from best value
Perspective on Cosmostats from Particle Physics Louis Lyons Particle Physics, Oxford and IC (CMS experiment, CERN CDF experiment, Fermilab) l.lyons@physics.ox.ac.uk Cosmostats Ascona July 2009
Topics • Similarities, differences, and what you do particularly well • What Particle Physicists have learnt • Discovery issues • Wish list and Conclusions Thanks to Stefen Lauritzen, CDF + CMS St Cttees (esp Bob Cousins, Luc Demortier, Joel Heinrich, Tom Junk), Subir Sarkar, Roberto Trotta, many speakers here.
Similarities between Cosmology and Particle Physics Differences What Astro/Cosmo do well
Similarities • Large data sets {LHC: event = Mbyte; total = 20 Pbytes} • Experimental resolution • Acceptance • Systematics • Separating signal from background (Glen Cowan, Ofer Lahav) • Parameter estimation (Fraction of Dark Energy) • Testing models (Is there Dark Energy?) • Search for signals: Setting limits or Discovery • {SM; Concordance} v {SUSY; Dark energy eos} • {Cosmostats, SCMA} and PHYSTAT
Differences • Background • Bayes or Frequentism? • Specific Astrophysics issues Time dependence Spatial structures Correlations Non-parametric methods Visualisation Cosmic variance • Blind analyses `
Bayes versus Frequentism Cosmologists use Bayes, unless forced to use Frequentism, while Particle Physicists ……… Goldstein at Durham PHYSTAT: Particle Physicists are last living dinosaurs still doing frequentist analysis Preprint: “As with any frequentist result, the use of priors means that the exact figures should be taken with a pinch of salt.” Talk (not here): We used a non-informative prior for the 12 parameters, and 7 pieces of data, to determine their posteriors Argument against constant priors: Fit y = a + b*x, with constant priors for a and b. Favours vertical line. Many talks here: “Marginalise over models”
BLIND ANALYSES Why blind analysis? Selections, corrections, method Methods of blinding Add random number to result * Study procedure with simulation only Look at only first fraction of data Keep the signal box closed Keep MC parameters hidden Keep fraction visible for each bin hidden After analysis is unblinded, …….. * Luis Alvarez suggestion re “discovery” of free quarks • David Friedenberg’s source detection
What Astrophysicists/Cosmologists do well • Glorious pictures • Scientists + Statisticians working together • Sharing data • Making data publicly available • Dealing with large data sets • Visualisation • Funding for Astrostatistics • Statistical software
Whirlpool Galaxy Width of Z0 3 light neutrinos
What Particle Physicists now know • (ln L) = 0.5 rule (Coverage) • Unbinned Lmax and Goodness of fit • Prob (data | hypothesis) ≠ Prob (hypothesis | data) • Comparing 2 hypotheses • Δ(χ2) ≠χ2 (Wilks’ Theorem) • Frequentism for bounded parameters: Feldman and Cousins • Use correct L (Punzi effect)
Statistical issues forDiscovery PHYSTAT-LHC Upper limits (e.g. WIMP flux) H0, or H0 versus H1 p-values: What p is not Combining p’s Methods for selecting between H0 and H1 Why 5σ? Look-elsewhere effect
Comparing Hypotheses: H0 versus H1 “How do you tell who is a Statistician, who is a Cosmologist and who is a Particle Physicist?” J.B: “Very hard for Bayesian, but worse for Frequentists” • Checking H0 (G of F), or H0 versus H1 (HT)? • p-values p-values or likelihood-ratios? Misunderstanding p-values Combining p-values • Look elsewhere effect: Why 5σ? How wide? Why not for exclusion? • Methods: Standard Frequentist Frequentist with ‘No choice’: p0 versus p1; Conditional Frequentism CLs Δχ2 Bayesian methods:Posterior odds, Bayes’ factor, BIC, AIC,… • Treatment of systematics for p-values Profile likelihood Frequentist methods Bayesian marginalisation Mixed
p-values for non-Gaussian distributions e.g. Poisson counting experiment, bgd = b P(n) = e-b* bn/n! {P = probability, not prob density} b=2.9 P 0 n 10 For n=7, p = Prob( at least 7 events) = P(7) + P(8) + P(9) +…….. = 0.03
Poisson p-values n = integer, so p has discrete values So p distribution cannot be uniform Replace Prob{p≤p0} = p0, for continuous p by Prob{p≤p0} ≤ p0, for discrete p (equality for possible p0) p-values often converted into equivalent Gaussian σ e.g. 3*10-7 is “5σ” (one-sided Gaussian tail)
p-value is not …….. Does NOT measure Prob(H0 is true) i.e. It is NOT P(H0|data) It is P(data|H0) N.B. P(H0|data) ≠ P(data|H0) P(theory|data) ≠ P(data|theory) “Of all results with p ≤ 5%, half will turn out to be wrong” Supposed to be funny, but is perfectly OK e.g. 1000 tests of energy conservation ~50 should have p ≤ 5%, and so reject H0 = energy conservation Of these 50 results, all are likely to be “wrong” Are p-values so misunderstood that it is unwise to use them?
p-values or L? • If statistic for p is L-ratio, can regard p-values as: • p-value method with L-ratio just as statistic; or • ii) L-ratio method, with pdf’s just as calibration
Combining different p-values Several results quote p-values for same effect: p1, p2, p3….. e.g. 0.9, 0.001, 0.3 …….. What is combined significance? Not just p1*p2*p3….. If 10 expts each have p ~ 0.5, product ~ 0.001 and is clearly NOT correct combined p S = z * (-ln z)j/j! , z = p1p2p3……. (e.g. For 2 measurements, S = z * (1 - lnz) ≥ z ) Slight problem: Formula is not associative Combining {{p1 and p2}, and then p3} gives different answer from {{p3 and p2}, and then p1} , or all together Due to different options for “more extreme than x1, x2, x3”. (χ2, ndf) = (100.0, 100) and (15.0, 1)
Combining different p-values Conventional: Are set of p-values consistent with H0? p2 SLEUTH: How significant is smallest p? 1-S = (1-psmallest)n p1 p1 = 0.01 p1 = 10-4 p2 = 0.01 p2 = 1 p2 = 10-4 p2 = 1 Combined S Conventional 1.0 10-3 5.6 10-2 1.9 10-7 1.0 10-3 SLEUTH 2.0 10-2 2.0 10-2 2.0 10-4 2.0 10-4
Why 5σ? • Past experience with 3σ, 4σsignals (but……) • Look elsewhere effect: Different bins (and binning) of this histogram Different cuts to produce data Different distributions Collaboration did/could look at Defined in SLEUTH • Bayesian priors: P(H0|data)P(data|H0) * P(H0) P(H1|data)P(data|H1) * P(H1) Bayes posteriorsLikelihoodsPriors Prior for {H0 = S.M.} >>> Prior for {H1 = New Physics}
Why 5σ? BEWARE of tails, especially for nuisance parameters Same criterion for all searches? {Cousins} Single top production Higgs Highly speculative particle Energy non-conservation
Methods for H0 versus H1 Standard Frequentist Frequentist with ‘No choice’ (Want to exclude H1) (Berger conditioning) CLs (for H1 exclusion) Δχ2 Bayesian methods: Posterior odds, Bayes’ factor, BIC, AIC,… {J.B: “….no agreement on a reasonable method of model selection.”} {Cousins: Almost no use of Bayes for model selection in HEP} {Lahav, and others}
Exclusion No decision Discovery (a) (b) H0 H1 t0 t t tcrit t0 p1 p0 Why ‘no decision’? When we accept H0, Need to know whether we can reject H1. Depends on separation of pdf’s H0 H1 (c) t1 t0 t
p0 v p1 contours, decision regions, CLs = p1/(1-p0), Punzi sensitivity
Luc Demortier,“p-values: What they are and how we use them”, CDF memo June 2006 http://www-cdfd.fnal.gov/~luc/statistics/cdf0000.ps Includes discussion of several ways of incorporating nuisance parameters Desiderata: Uniformity of p-value (averaged over ν, or for each ν?) p-value increases as σν increases Generality Maintains power for discovery
Ways to incorporate nuisance params in p-values • Supremum Maximise p over all ν. Very conservative • Conditioning Good, if applicable • Prior PredictiveBox. Most common in HEP p = ∫p(ν) π(ν) dν • Posterior predictiveAverages p over posterior • Plug-in Uses best estimate of ν, without error • L-ratio • Confidence intervalBerger and Boos. p = Sup{p(ν)} + β, where 1-β Conf Int for ν • Generalised frequentistGeneralised test statistic Performances compared by Demortier
Particle Physicist’s wish list • Is absolute coverage really necessary? • Criteria for ‘best’ intervals • Software for Neyman construction in several dimensions • When data to be combined are a bit inconsistent Measurements of a single quantity (0±1 and 4±1) Fitting 3000 data points with 24 params (χ2/ndf OK; Δχ2=100 for params) Non-param? bsγ and g-2 (Roberto Trotta) • Look elsewhere effect • G of F for unbinned multivariate data • Choosing between 2 hypotheses Quoting signif of weak data No decision • When Wilks’ Th is not satisfied (for distribution of Δχ2) Deviations small? Simulation for 5σ (p = 3*10-7) • Expected or observed errors? • Nuisance parameters
Observed or expected uncertainty? Observed: Benefit by fortunate fluctuations Cox’s choice of measuring device ALEPH measurement of m(τ) Efron and Hinkley 0±1 and 4±1 Expected: Better for combining, or choosing better method n ±n; τ± τ/n (and better than estimating from spread); binomial param Error on mean of Gaussian (use known rather than estimated width)
Conclusions • Common problems: scope for learning from each other Large data sets Separating signal Testing models Signal’s Discovery • Targetted Workshops e.g. CERN: PDF4LHC (Continuing) Banff: July 2010 Discovery issues PHYSTAT: CERN 2011? Discovery issues • Summer schools: CERN, FNAL, Durham, Spain,….
Excellent Workshop: Great talks Vigorous interactions Bayesian ideas and detailed implementations Statisticians: Non-parametric approaches Let’s have more!
Excellent Workshop: Great talks Vigorous interactions Bayesian ideas and detailed implementations Statisticians: Non-parametric approaches Let’s have more! Very big THANK YOU to Roberto, Martin and Uros !