Download

1 / 40
400 likes | 561 Views
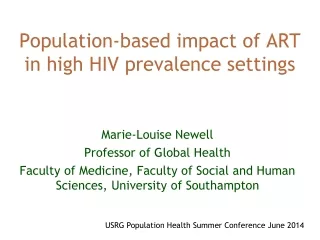
Comparison of VCT and Population-based HIV Prevalence. The 2 nd Global HIV/AIDS Surveillance Meeting Bangkok, Thailand March 2-5, 2009. Fulgentius Baryarama CDC-Uganda. The views presented are of the author and do not represent views of his employer. Outline. Background ANC Surveys

E N D
Comparison of VCT and Population-based HIV Prevalence The 2nd Global HIV/AIDS Surveillance Meeting Bangkok, Thailand March 2-5, 2009 Fulgentius BaryaramaCDC-Uganda The views presented are of the author and do not represent views of his employer
Outline • Background • ANC • Surveys • PMTCT • VCT • Lessons from VCT in Uganda • Objectives and Methods • Results • Conclusions
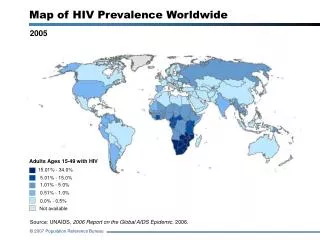
Background • Population based surveys provide more representative point prevalence estimates • However, ANC data remains the main HIV surveillance data source for epidemic trends • Yet, ANC data are known to overestimate national HIV prevalence
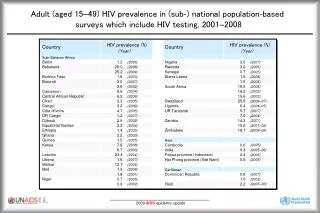
Survey : ANC Prevalence Ratio • E. Gouws, et al. (2008). Sex Transm Infect:84(Suppl) i17-i23 • National based surveys from 26 countries, 2001-2007 • ANC based prevalence overestimates both urban and rural HIV prevalence by 20% • Recommended an adjustment factor of 0.8
PMTCT data • Reviews of PMTCT data have shown • Potential to replace ANC surveillance • But PMTCT has biases similar to ANC data • Both share the same target population • Both have high risk young women • In addition: Opting out of HIV testing
VCT Data • Data from multiple VCT providers • Different VCT provision approaches • Stand alone sites • Health facility based • Home-based VCT • Outreaches • Self-selection bias • Growing database • Utility of VCT data for HIV surveillance
The AIDS Information Centre (AIC) • AIC was formed in 1990 to offer VCT in Uganda • AIC has since tested over 2 million clients in over 200 sites
Lessons - 1992-2005 1: Negative HIV clients tend to take repeat tests 2: Hence the prevalence of first-time testers is higher than for the entire VCT population 3: VCT clients who test due to illness have extremely high HIV prevalence
Lessons –De-duplication Lesson 4: Various methods for de-duplicating VCT clients in the absence of a unique identifier exist Example with 2007 data: N=150,344 not reporting illness (ID= Client ID, UTC=Unique Testing Code from client data)
Lessons -1992-2000 B) 20-24 Years A) 15-19 Years Lesson 5: Consistentdisparityin HIV prevalence by age between VCT and ANC data C) 25+ Years
Objectives of the Study • To compare HIV prevalence from routine VCT data with a population-based sero-survey • To assess the utility of VCT data as a supplemental data source for HIV surveillance
Methods – Population Based Survey • Conducted from August 2004 to Jan 2005 • Based on a national representative sample of adults age 15 – 59 years • Collected data from 9,529 households in 417 enumeration areas using a 2-stage cluster sample
Methods -Survey • 11,454 women and 9,905 men were eligible • Questionnaire completed for 95% of women and 89% of men • Blood specimen collected from 90% of women and 84% of men
Methods - VCT Data (Same period as Survey) • 8 Stand alone sites • AIC Staff • Cost sharing • 19, 972 clients • 152 Health facilities • MOH Staff • Free VCT Services • 55,668 clients
Methods –GIS • Location of residence of VCT clients not available • 15km and 30km buffers drawn around each VCT site to estimate catchment areas • 83% of survey clusters within 30 km and 56% within 15km of a VCT site
Methods –Data Management • Analysis variables in separate VCT and survey data were made compatible • Exclusions: • VCT clients who reported illness as reason for testing • VCT records with a subsequent visit to avoid duplicates • Data were merged to one database clearly labeling records as either VCT or survey
Methods –Data Analysis • Age-standardized prevalence computed with the survey as the standard population • HIV prevalence presented by 5-year age groups stratified by rural or urban residence and sex • Comparisons of VCT and survey prevalence were based on 95% CIs
Methods – Sub-analyses • Survey participants within 15km of a VCT site • VCT clients at stand-alone sites • VCT clients at Health Facility (HF) sites
Map of Uganda showing location of Survey Clusters, VCT Sites and 15/30 km buffers
Study Population - Sex Percent women
Study Population - Residence Percent residing in urban area
Study Population – Previous HIV Testing Percent previously tested for HIV
HIV Prevalence 9.7 10.1 8.8 8.2 5.9 5.2 Rural Urban Total
Conclusions-1 Overall, HIV prevalence higher among VCT clients than survey population, 8.8% vs. 5.9% Difference attributed to rural areas where VCT prevalence was higher than survey prevalence, 8.2% versus 5.2% However, for urban areas, survey and VCT HIV prevalence were similar, at about 10%
Conclusions-2 • Survey prevalence within 15km of a VCT site was significantly lower than general survey prevalence • HIV prevalence at Health Facility VCT sites showed more stable patterns by age • Differences in clientele between VCT and survey populations more marked in stand alone than health facility sites
Challenges • Limited access of VCT services to rural areas • Lack of national VCT data sets with individual client data from all key VCT providers – only aggregated data are reported • Lack of multi-country comparisons of VCT and survey data including trends from multiple surveys
Questions Does stand alone VCT data have potential for supplemental HIV surveillance? Does health facility VCT data have potential for HIV prevalence trends? Does health facility VCT data have potential for point HIV prevalence estimates …Yes, for early warning purposes only …Yes …Not until challenges are addressed
Acknowledgements • Rebecca E. Bunnella • Jonathan H. Mermina • Wolfgang Hladika • Livia Montanab • Alex Opioc • Joshua Musinguzic • Wilford Kirungic • Laban Waswa-Brightd • VCT clients and survey participants aCenters for Disease Control and Prevention – Uganda bMacro International cUganda Ministry of Heath dAIDS Information Centre
Survey : ANC Prevalence Ratio* *Extracted from: E. Gouws, et al., 2008