Download
1 / 23
230 likes | 366 Views
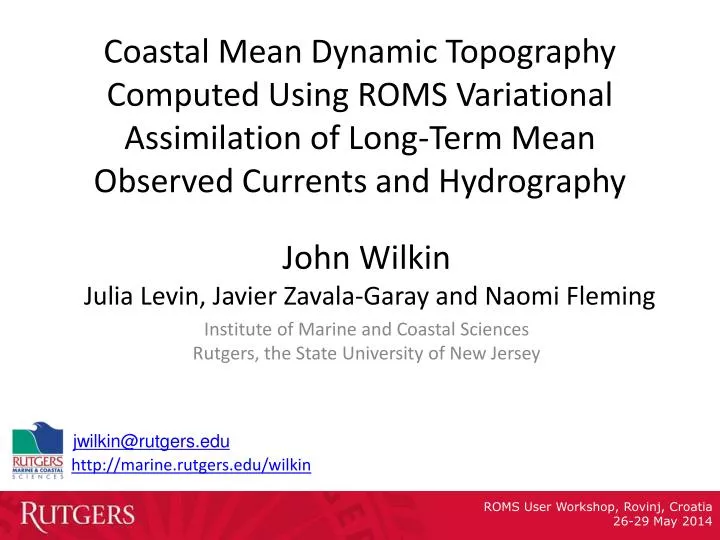
Coastal Mean Dynamic Topography Computed Using ROMS Variational Assimilation of Long-Term Mean Observed Currents and Hydrography. John Wilkin Julia Levin, Javier Zavala- Garay and Naomi Fleming Institute of Marine and Coastal Sciences Rutgers , the State University of New Jersey.

E N D
Coastal Mean Dynamic Topography Computed Using ROMS Variational Assimilation of Long-Term MeanObserved Currents and Hydrography • John Wilkin Julia Levin, Javier Zavala-Garay and Naomi Fleming • Institute of Marine and Coastal Sciences Rutgers, the State University of New Jersey jwilkin@rutgers.edu http://marine.rutgers.edu/wilkin ROMS User Workshop, Rovinj, Croatia26-29 May 2014
NSF Ocean Observatories Initiative Pioneer Array OOI Pioneer Array focuses on shelf-sea/deep-ocean exchange at the shelf-break front
Mean circulation from an idealized 2-D model of MAB shelf dynamics (Lentz, 2008) Along-shelf momentum includes significant along-shelf pressure gradient. Lentz (2008) estimates slope of 3.7 x 10-8 = 0.03 m in 800 km 100 m Lentz (JPO, 2008) Lentz, S., 2008: Observations and a model of the mean circulation over the Middle Atlantic Bight continental shelf, JPO, 38, 1203-1221
ROMS 2-dimensional climatological simulation (Zhang et al. 2011) • Simple nudging to along-shelf average of regional 3-D climatology “MOCHA” (Fleming and Wilkin) and imposed along-shelf pressure force equivalent to a mean sea level tilt • Offshore flow near surface and bottom in all seasons, balanced by onshore flow at mid-depth • Mean flow is similar to long-term mooring measurements • Persistent upwelling near shelf-break Zhang, W. G., G. Gawarkiewicz, D. McGillicuddy and J. Wilkin, 2011, Climatological mean circulation at the New England shelf break, J. Phys. Oceanogr., 41, 1874-1893, doi: 10.1175/2011JPO4604.1
ROMS 2-dimensional climatological simulation (Zhang et al. 2011) sea level tilt x 10-7 distance from 100-m isobath (km) Cross-shelf distribution of the along-shelf sea level tilt imposed in simulations. Symbols show previous estimates of annual mean (★) and summer mean (, ) tilt. Zhang, W. G., G. Gawarkiewicz, D. McGillicuddy and J. Wilkin, 2011, Climatological mean circulation at the New England shelf break, J. Phys. Oceanogr., 41, 1874-1893, doi: 10.1175/2011JPO4604.1
Mean circulation from an idealized 2-D model of MAB shelf dynamics (Lentz, 2008) Along-shelf momentum includes significant along-shelf pressure gradient. Lentz (2008) estimates slope of 3.7 x 10-8 = 0.03 m in 800 km Lentz (JPO, 2008) MDT from ROMS 4D-Var of climatological data Lentz, S., 2008: Observations and a model of the mean circulation over the Middle Atlantic Bight continental shelf, JPO, 38, 1203-1221
Climatological model configuration is the same as the “ESPreSSO” real-time ROMS system myroms.org/espresso model domain maracoos.org MARACOOS Observing System
Data assimilated in the mean circulation analysis Mean velocity from long-term moorings (> 200 days) Mean depth-averaged current (blue), and mean wind stress (red)from current time series longer than 200 days. Light lines are 50-, 100-, and 1000-m isobaths. Lentz, S., 2008: Observations and a Model of the Mean Circulation over the Middle Atlantic Bight Continental Shelf, JPO, 38(6), 1203.
Data assimilated in the mean circulation analysis Along-shelf velocity Long-term mean velocity from M/V OleanderADCP transect (Flagg et al. 2006) 20 • ADCP mounted on vessel making monthly transits from NY to Bermuda • Mean shelf-break jet 13 cm/s, max 35 cm/s, 30 km jet width • Vertical scale of jet is 50 m, relative vorticity/f ~ 0.2 • Data shows offshore flow near bottom consistent with observations • Jet core is over the 120 m isobath but varies from 80 to 150 m isobaths 400 280 120 Cross-shelf Distance (km) Across-shelf Velocity Flagg, C., M. Dunn, D.-P. Wang, H. Rossby, and R. Benway,2006:A study of the currents of the outer shelf and upper slope from a decade of shipboard ADCP observations in the Middle Atlantic Bight, J. Geophys. Res., 111, C06003. 280 120 Cross-shelf Distance (km)
Data assimilated in the mean circulation analysis Long-term mean surface current from HF radar (CODAR) velocity
Model configuration for climatological simulations • Data Assimilation experiments IS4DVAR: 2-day analysis window: • Control variables • initial conditions, boundary conditions, and surface forcing • Data: • T/S 3-D climatology, and velocity • data are repeated in the analysis interval to constrain time evolution of solution Annual mean DA analysis: • MDT becomes prior for subsequent seasonal mean experiments Seasonal DA experiments: • TS, TSV and TSVH … • 7 km horizontal grid; 36 s-levels • surface stress and air-sea fluxes from mean of 1998-2007 NCEP NARR reanalysis • mean USGS river discharge • no tides Prior solution: • average of 12 short forward (no DA) simulations • initial and boundary T/S from climatology, sea level and velocity from HYCOM
Seasonal Data Assimilation experiments • Analyses for each month using that month’s average of surface forcing and data (T/S velocity, and Jason SLA) • TS: 3-D temperature and salinity climatology only • TSV: T/S and velocity (current-meters, Oleander and CODAR) • TSVH: T/S, velocity and monthly altimetry Compute new annual mean fields from monthly mean analyses (best estimate of MDT) Compute seasonal means for analysis of seasonal cycle of MAB dynamics
DA fit to data: velocity seasonal variance
TSV Summer-winter cycle of SSH along Jason ground-tracks compared to 2006-2011 mean of Jason 6 3 2 1 5 4
TSVH Summer-winter cycle of SSH along Jason ground-tracks compared to 2006-2011 mean of Jason 6 3 2 1 5 4
Computing MDT to combine with coastal altimetry in a real-time coastal ocean forecast system • 4D-Var with boundary sea level and velocity in control variables • Data: Regional hydrographic climatology of temperature and salinity; surface current from HF-Radar; mean of monthly shipboard ADCP currents (the Oleander Line) and Line W; ~40 moored current-meter deployments (> 200 days) • Annual mean and seasonal mean analyses (seasonal analyses included Jason SLA in the assimilated data) • Best estimate MDT derived from mean of monthly analyses • MDT recovers along-shelf mean slope absent from boundary conditions adopted from a global data assimilative model. • Forecast model improves using new MDT in altimetry DA, and freely running simulations improve with MDT in open boundary conditions ROMS User Workshop, Rovinj, Croatia26-29 May 2014