Matplotlib's Intro for Visualizing Data in Comprehensive Detail
0 likes | 5 Views
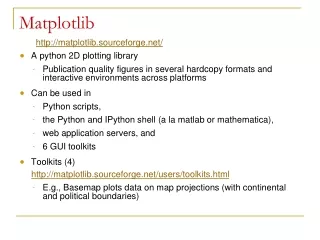
Matplotlib is a versatile tool for data visualization, covering installation basics to advanced techniques. It proves invaluable in real-world applications, offering tips for effective visualization, interactive features, and geospatial data integration. Matplotlib enhances storytelling with data, making it a powerful ally in crafting compelling narratives. Whether mapping data points, creating heatmaps, or visualizing machine learning model performance, Matplotlib stands out as a key asset for insightful and impactful visualizations across diverse industries.

Download Presentation 
Matplotlib's Intro for Visualizing Data in Comprehensive Detail
An Image/Link below is provided (as is) to download presentation
Download Policy: Content on the Website is provided to you AS IS for your information and personal use and may not be sold / licensed / shared on other websites without getting consent from its author.
Content is provided to you AS IS for your information and personal use only.
Download presentation by click this link.
While downloading, if for some reason you are not able to download a presentation, the publisher may have deleted the file from their server.
During download, if you can't get a presentation, the file might be deleted by the publisher.
E N D
Presentation Transcript


More Related