Download
1 / 55
590 likes | 680 Views
Mechanical Properties and Property Testing. Chapter 6. Why?. Use mechanical properties in the design process Properties are affected by Bonding type Crystal Structure Imperfections Processing. Types of Mechanical Testing. Slow application of stress Tensile testing

E N D
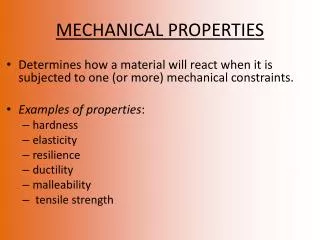
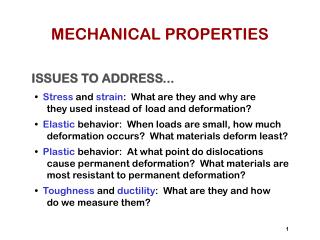
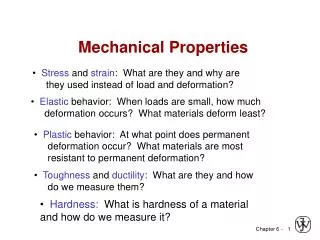
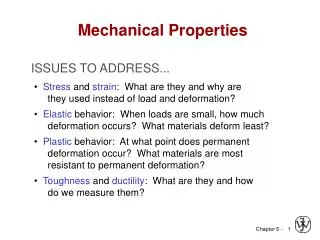
Why? • Use mechanical properties in the design process • Properties are affected by • Bonding type • Crystal Structure • Imperfections • Processing
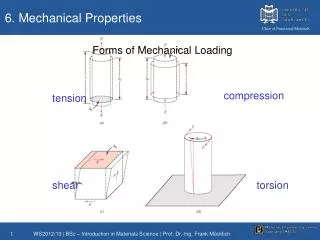
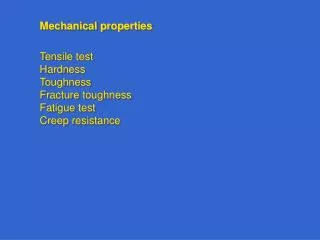
Types of Mechanical Testing • Slow application of stress • Tensile testing • Allows dislocations to move • Rapid application of stress • Impact testing • Ability of a material to absorb energy as it fails
Types of Mechanical Testing • Fracture Toughness • How does a material respond to cracks and flaws • Fatigue • What happens when loads are cycled? • High Temperature Loads • Creep
Strength of Materials • You will study most of these tests in more detail in “Strengths of Materials”
Tensile Testing • We have a United brand tensile testing machine • Often called an Instron – which is a brand name • Slowly pulls on a sample • The sample deforms, then fails • We measure the load and the deformation
Can be either flat or round Used for both plastics and metals – but not ceramics Tensile test specimens
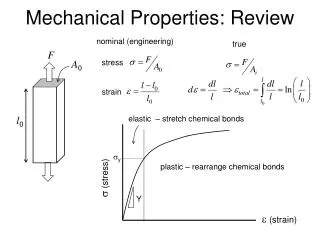
Engineering Stress F is the applied force A0 is the original cross-sectional area of the sample Units are the same as pressure Engineering Strain Δl - Change in length of the specimen l0 – Original length of the specimen Dimensionless – though often expressed as in/in Engineering Stress and Strain F
E – Modulus of Elasticity sy – Yield strength based on 0.2% offset Modulus of Resiliance Area under the elastic portion of the curve Tensile Strength Failure stress Ductility Toughness Results of the Tensile Test Tensile Strength Fracture stress Yield Strength Engineering Stress, psi Toughness Slope of the elastic portion of the stress-strain curve, E=σ/ε E=Modulus of Elasticity Modulus of Resiliance Slope = E Ductility (Elasticity) Engineering Strain, in/in After John D. Russ – Materials Science – A Multimedia Approach
Some metals have well defined yield points, which are easy to identify Yield Point Typical of Copper, Most Low Carbon Steels and Some Aluminum Alloys Not all materials have a well defined yield point
Upper Yield Point Lower Yield Point Typical of Copper, Most Low Carbon Steels and Some Aluminum Alloys Typical of Aluminum and Some Low Carbon Steels Some low carbon steels and many aluminum alloys exhibit a drop in stress once plastic deformation starts. This occurs because dislocations that were immobilized at point defects or dislocation tangles are able to move again briefly.
Use the average value of the lower yield stress as the yield point, for these materials Toothed shape typical of lower yield points
Cast Iron and Polymers show a gradual change from elastic to plastic deformation – again, there is no obvious yield point Typical of Ductile Cast Iron Typical of Polymers
The 0.2% offset yield allows us to systematically select the yield point – even when it isn’t obvious • Draw a line starting at • .002 strain (0.2% strain) • Parallel to the elastic portion of the curve • With the same slope as the modulus of elasticity • The 0.2% offset yield is the point where the stress strain curve and the offset yield line intersect
Yield Point Yield Point 0.002 strain 0.002 strain Yield Point Typical of Copper, Most Low Carbon Steels and Some Aluminum Alloys Typical of Aluminum and some Low Carbon Steels Yield Point Typical of Ductile Cast Iron Typical of Polymers
Tensile Test • Be sure to watch the movies on the CD accompanying your textbook • The Stress-Strain Diagram Card is especially good!! • Deformation happens when the atoms slip. • Slip occurs on the close packed plane, in the close packed direction.
Tensile Test • Remember, we are not testing samples that are a single crystal – there are many grains, all aligned in different directions. • However, within a single crystal deformation occurs similarly to the models shown on the next several slides
Force Elastic Deformation
Once the force is released, the material returns to its original shape
Force In plastic deformation enough force is applied that slip eventually occurs
Necking Plastic Deformation
True stress A=actual cross sectional area True strain True Stress/strain Notice that true stress continues to increase with increasing true strain
Ceramics • Failure in ceramics usually occurs because of flaws • A tensile test would give a wide range of values, depending on the flaws in the sample you chose • Three Point Compression or Bend Test
Typical graph showing 3 point bend strength of a plastic material http://www.lloyd-instruments.co.uk/testtypes/graphs/3point.jpg
(c)2003 Brooks/Cole, a division of Thomson Learning, Inc. Thomson Learning™ is a trademark used herein under license. Hardness Test • Brinell • Rockwell • our machine
Hardness is a surface property • There are a number of processes that can improve the surface hardness, without affecting the bulk properties • For example carburizing
Impact Test • Charpy – our machine • Izod • Effect of Temperature • Effect of Structure
(c)2003 Brooks/Cole, a division of Thomson Learning, Inc. Thomson Learning™ is a trademark used herein under license.
Transition Temperature Energy is readily absorbed Energy is not absorbed, causing failure
Affect of Crystal Structure • FCC crystals absorb more energy • Often they do not exhibit a transition temperature Why?
Slip is easy in FCC cells • Even at low temperature slip is comparatively easy in FCC cells • At low temperatures the slip systems in BCC cells become inactive, making it harder to absorb energy
Liberty ships were cargo ships built during WW II They were mass produced on an emergency basis 2751 vessels built from 1941 to 1945 Largest number of ships every produced to a single design Design life of 5 years Average construction time was 42 days The Robert E Peary was built in under 5 days Liberty Ships SS John W. Brown, one of two surviving operational Liberty ships http://en.wikipedia.org/wiki/File:SS_John_W_Brown.jpg
The hulls were welded instead of riveted – a new innovation Riveted hulls were labor intensive to build – and there was a lack of skilled labor Rosy the Riveter J. Howard Miller's "We Can Do It!", commonly mistaken to be Rosie the Riveter
Early on 30% of the ships suffered from brittle fractures Improved in later designs to 5% 3 of the Liberty ships broke in half! Brittle Fractures SS John P. Gaines – which sank in the Aleutions – shown is the back half of the ship – 10 lives were losthttp://www.mech.uwa.edu.au/DANotes/fracture/maritime/maritime.html
Brittle fractures were a problem with other designs as well Nearly 500 T2 tankers were built during WWII – with the same problems T2 Tanker SS Schenectadyhttp://www.mech.uwa.edu.au/DANotes/fracture/maritime/maritime.html
In January 1943 the one-day old T2 tanker SS Schenectady had just completed successful sea trials and returned to harbour in calm cool weather when . . . "Without warning and with a report which was heard for at least a mile, the deck and sides of the vessel fractured just aft of the bridge superstructure. The fracture extended almost instantaneously to the turn of the bilge port and starboard. The deck side shell, longitudinal bulkhead and bottom girders fractured. Only the bottom plating held. The vessel jack- knifed and the center portion rose so that no water entered. The bow and stern settled into the silt of the river bottom."The ship was successfully repaired.
The failures were attributed to: • The all- welded construction which eliminated crack- arresting plate boundaries which are present in riveted joints • The presence of crack- like flaws in welded joints performed by inexperienced operators pressed into service by the exigencies of the programme • The use of materials whose low resistance to crack advance ( toughness ) was further reduced by low temperatures. http://www.mech.uwa.edu.au/DANotes/fracture/maritime/maritime.html
Showed that the failures were not due to faulty welds but to the grade of steel, which when subjected to low temperatures became brittle These ships were used in the North Atlantic which was cold They were regularly below the ductile to brittle transition temperature Because the ship was welded instead of riveted the cracks could travel long distances Welded hatch covers were a common source of crack initiation Constance Tipper http://www-g.eng.cam.ac.uk/125/1925-1950/tipper.html
Fracture Mechanics • Stress Concentrators • Ductile materials are less subject to failure from cracks or flaws
Fatigue • Airplane wings vibrate • Cracks or flaws can grow • Eventually failure occurs • Endurance Limit • Stress below which there is a 50% probability that failure by fatigue will never occur
(c)2003 Brooks/Cole, a division of Thomson Learning, Inc. Thomson Learning™ is a trademark used herein under license. Rotating Cantilever Beam Test
(c)2003 Brooks/Cole, a division of Thomson Learning, Inc. Thomson Learning™ is a trademark used herein under license. Endurance Limit