Download
1 / 14
140 likes | 269 Views
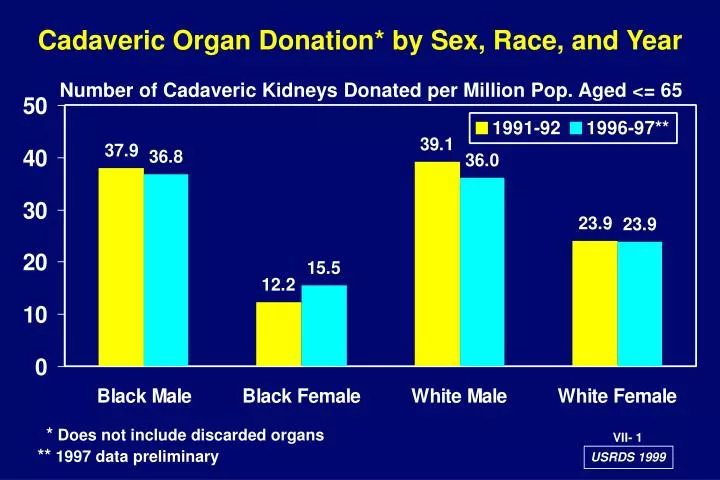
Cadaveric Organ Donation* by Sex, Race, and Year. Number of Cadaveric Kidneys Donated per Million Pop. Aged <= 65. * Does not include discarded organs ** 1997 data preliminary. VII- 1. USRDS 1999. Number of Renal Transplants by Donor Source and Year, 1993-97.

E N D
Cadaveric Organ Donation* by Sex, Race, and Year Number of Cadaveric Kidneys Donated per Million Pop. Aged <= 65 * Does not include discarded organs ** 1997 data preliminary VII- 1 USRDS 1999
Number of Renal Transplants by Donor Source and Year, 1993-97 Number of Transplants (Log Scale) 8,523 3,217 705 8,118 1.2% increase/year 5.1% increase/year 37.5% increase/year Cadaveric Living Related 2,639 Living Unrelated 197 * VII- 2 Year of Transplantation * Preliminary USRDS 1999
First Living Donor Transplantation Counts and Rates by Recipient Age, 1997* Number of Transplants Tx per 100 Dialysis Patient Years Recipient Age Recipient Age VII- 3 * Preliminary; ages > 65 not shown USRDS 1999
First Cadaveric Transplantation Counts and Rates by Recipient Age, 1997 * Number of Transplants Tx per 100 Dialysis Patient Years Recipient Age Recipient Age VII- 4 * Preliminary; ages > 65 not shown USRDS 1999
First Cadaveric Transplantation Rate by Recipient Age, Sex, and Race, 1994-97 Tx Rate per 100 Dialysis Patient Years Age 0 - 19 Age 20 - 44 Age 45-64 VII- 5 Recipient Sex USRDS 1999
Five-Year Trend in First Cadaveric Transplantation Rate by Age, 1993-97 Tx Rate per 100 Dialysis Patient Years 1993 1994 1995 1996 1997* 1993 1994 1995 1996 1997* 1993 1994 1995 1996 1997* 0-19 20-44 45-64 VII- 6 Recipient Age * Preliminary USRDS 1999
Five-Year Trend in Repeat Cadaveric Transplantation Rates by Age, 1993-97 Tx Rate Per 100 Dialysis Patient Years 1993 1994 1995 1996 1997* 1993 1994 1995 1996 1997* 1993 1994 1995 1996 1997* VII- 7 Recipient Age * Preliminary USRDS 1999
Recipient To Donor Ratio of ABO Blood Type Organs for Cadaveric Transplants, 1997* Recipient/Donor Ratio 1.40 1.11 1.03 0.93 * Excludes missing blood types ** Preliminary VII- 8 Recipient Blood Type USRDS 1999
98.0 97.9 96.5 95.7 One-Year Patient Survival*, First Transplant by Race, Donor Type, and Year, 1987-96 Patient Survival (%) LD - White LD - Black CAD - Black CAD - White ** • Year of Transplantation VII- 9 *Adjusted for age, sex, and cause of ESRD; **1997 followup is preliminary USRDS 1999
One-Year Graft Survival*, First Transplants, by Race, Donor Type and Year, 1987-96 Graft Survival (%) 94.1 93.5 88.9 86.6 LD - White LD - Black CAD - White CAD - Black 1987 88 89 90 91 92 93 94 95 1996** Year of Transplantation VII- 10 *Adjusted for age, sex, and cause of ESRD; **1997 followup is preliminary USRDS 1999
Annual Rate of First Cadaveric Transplant Graft Loss, During First Year Post Transplant, 1987-96 Adjusted* Annual Rate of Graft Loss (%) 1987 1988 1989 1990 1991 1992 1993 1994 1995 1996** Year of Transplantation **1997 followup is preliminary *Adjusted for age, sex, race, and cause of ESRD VII- 11 USRDS 1999
Annual Rate of First Living Donor Transplant Graft Loss, During First Year Post Transplant, 1987-96 Adjusted* Annual Rate of Graft Loss (%) 1987 1988 1989 1990 1991 1992 1993 1994 1995 1996** Year of Transplantation **1997 followup preliminary *Adjusted for age, sex, race, and cause of ESRD VII- 12 USRDS 1999
First Living Donor Graft Survival* by Year of Transplantation, 1986-95 Graft Survival (%) 100 90 80 70 60 50 40 30 - - -Projections to Median Graft Survival Actual Graft Survival 1986-87 1994-95 1988-89 1992-93 1990-91 Years Since First Transplant VII- 13 *Adjusted for age, sex, race, and cause of ESRD USRDS 1999
First Cadaveric Graft Survival* by Year of Transplantation, 1986-95 Graft Survival (%) 100 90 80 70 60 50 40 30 - - - Projections to Median Graft Survival Actual Graft Survival 1988-89 1992-93 1994-95 1986-87 1990-91 Years Since First Transplant VII- 14 *Adjusted for age, sex, race, and cause of ESRD USRDS 1999