Download
1 / 43
460 likes | 676 Views
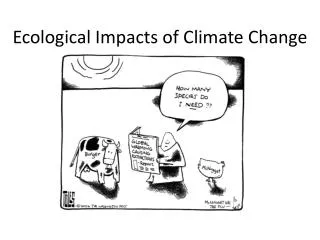
Impacts of Climate Change on the Transportation Sector: Design and Operations Implications. Michael D. Meyer, P.E., F. ASCE F.R. Dickerson Professor School of Civil and Environmental Engineering Georgia Institute of Technology. Extent of Nation’s Transportation Infrastructure.

E N D
Impacts of Climate Change on the Transportation Sector: Design and Operations Implications Michael D.Meyer, P.E., F. ASCE F.R. Dickerson Professor School of Civil and Environmental Engineering Georgia Institute of Technology
Extent of Nation’s Transportation Infrastructure • Highways (public) • 46,873 miles of Interstate highway • 115,500 miles NHS roads • 3,849,259 miles of other roads • 580,000 bridges • Airports • 5,270 public use airports • Rail • 95,664 Class 1 miles • 15,388 regional miles • 29,197 local miles • 23,000 Amtrak miles • Transit (directional miles) • 165,854 bus miles • 4,407 commuter rail • 1,596 heavy rail • 1,097 light rail • Transit stations • 1,153 commuter rail • 1,023 heavy rail • 723 light rail • Navigable channels • 26,000 miles • Commercial waterway facilities • Great Lakes (600 deep/150 shallow draft) • 2,320 Inland shallow draft • 4,298 ocean deep/1,761 shallow draft • 257 locks • Pipeline • 60,043 miles crude • 71,310 miles product • 298,000 miles transmission • 1,139,800 miles distribution
60,000 miles in FEMA coastal flood zone; 36,000 bridges within 15 nautical miles of coasts
Gulf Coast Study Freight Rail Lines Vulnerable to Storm Surge of 18 feet
Transportation infrastructure that is vulnerable to 18 feet of storm surge includes: • 51% of interstate miles, 56% of arterial miles, and • most transit authorities • 98% of port facilities vulnerable to surge and • 100% to wind • 33% of rail miles operated, 43% of freight facilities, • 22 airports in the study area at or below 18 feet MSL • Potentially significant damage to offshore facilities
Fundamental to the application of engineering design standards is an understanding of how environmental factors and conditions will affect both the behavior of the overall structure itself as well as of the individual material components of the design.
Critical Components of Infrastructure Design • Subsurface conditions • Materials specifications • Cross sections/standard dimensions • Drainage and erosion • Structures • Location engineering
Suggested Minimum Design Storm Frequency and Spread. “The intensity of rainfall events may significantly affect the selection of design frequency and spread.” FHWA, Urban Drainage Design Manual, 2001.
Temperature, for example, …….. “Two climatic factors, temperature and moisture, are considered to influence the structural behavior of the pavement.” “With respect to subgrade strain and fatigue of cement- and limestabilized base or subbase courses, the design air temperature is the average of two temperatures: (1) the average daily mean temperature and (2) the average daily maximum temperature during the traffic period.”
Temperature, for example, …….. “Because of the extreme sensitivity of critical stresses in rigid pavements to temperature gradients, consideration of hourly variation in temperature conditions is necessary.”
Keller, Jake A.; Armstrong, Amit; Flood, Michael; Meyer, Michael D., AN APPROACH TO ADDRESSING THE IMPACTS OF CLIMATE VARIABILITY ON ROADWAY AND BRIDGE DESIGN, Paper presented at the Annual Meeting of the Transportation Research Board, Jan. 2011.
Keller, Jake A.; Armstrong, Amit; Flood, Michael; Meyer, Michael D., AN APPROACH TO ADDRESSING THE IMPACTS OF CLIMATE VARIABILITY ON ROADWAY AND BRIDGE DESIGN, Paper presented at the Annual Meeting of the Transportation Research Board, Jan. 2011.
Keller, Jake A.; Armstrong, Amit; Flood, Michael; Meyer, Michael D., AN APPROACH TO ADDRESSING THE IMPACTS OF CLIMATE VARIABILITY ON ROADWAY AND BRIDGE DESIGN, Paper presented at the Annual Meeting of the Transportation Research Board, Jan. 2011.
Representative Design Formulae and Possible Effects: Hydrology Keller, Jake A.; Armstrong, Amit; Flood, Michael; Meyer, Michael D., AN APPROACH TO ADDRESSING THE IMPACTS OF CLIMATE VARIABILITY ON ROADWAY AND BRIDGE DESIGN
Keller, Jake A.; Armstrong, Amit; Flood, Michael; Meyer, Michael D., AN APPROACH TO ADDRESSING THE IMPACTS OF CLIMATE VARIABILITY ON ROADWAY AND BRIDGE DESIGN
Federal Highway Administration “In the coastal environment, design practices assume that flood events would essentially behave in a manner similar to a riverine environment, which assumes a 50-year storm event…result is that designs do not consider the effect of wave actions on the bridge.”
“State DOTs find themselves in the position that their own regulations and guidelines do not permit them to consider alternative bridge design criteria.” Recommendation: 100-year design storm that considers wave and surge effects as well as the likelihood of pressure scour.”
Proactive Strategies to Flood Risk Preventing flooding by improving the rainfall capture and storage capacity of a catchment (e.g. by enhancing or mimicking the water storage capacity of the soil); Increasing conveyance capacity to disperse floodwaters; Creating policies to maintain existing levels of service which incorporate climate change factors at the time of repairs or upgrades; NZ Transport Agency, Climate Change Effects on the Land Transport Network, Volume Two: Approach to Risk Management, 2009
Establishing physical protection measures, e.g. building stop-banks; Managing the effects of flooding by removing at-risk land use such as infrastructure and the built environment in floodplains; and Managing the expectations of communities in flood-prone areas to expect and cope with flood events. NZ Transport Agency, Climate Change Effects on the Land Transport Network, Volume Two: Approach to Risk Management, 2009
NCHRP 20-83(5) Climate Change and the Highway System: Impacts and Adaptation Approaches
Climate Adaptation Planning Identify critical performance measures Identify predominant climate change trends and factors for region Identify critical assets in the network Identify impact of these changes on local environmental conditions Conduct risk appraisal of vulnerabilities and environmental changes Identify vulnerabilities of highway system to these changing conditions Identify trigger levels Assess feasibility and cost effectiveness of adaptation strategies Network Functions Asset A Asset B Asset C Asset X Change design standards Change operating strategies Change maintenance practices Change construction practices Etc. Apply triggers Identify affected highway agency functions
Michigan DOT More Intense Storms – Strategy: Design assets that are less impacted by affects of Climate Change • Larger hydraulic openings for bridges over waterways • Heavier and lengthier armoring of river and stream banks and ditches to prevent erosion • Investigate greater pavement crowns to move runoff off of pavement quicker
Design of additional in-system detention to meter runoff outflow • Eliminate bridge design elements that could make a bridge scour critical • i.e. piers in the river, spread footings, use more sheet piling left in place • Design terraced vegetated slopes using a variety of plant species
Design more robust pavement markings that can be seen during wet/night conditions • Larger capacity pumps/pump stations for below grade freeways to prevent flooding
So… • As primarily an “application” field, we rely on information produced by many of you • Temporal and spatial scale issues • “It all depends…” approach to design…for different components of a typical design • We are learning now about extreme events that are exceeding our design capacities, and what this means for future approaches….infrastructure with different useful lives
Better approaches for incorporating uncertainty are needed … risk analysis • Multiple strategy types: avoid, relocate, abandon, protect, etc. • Growing interest in how we think about infrastructure vulnerability and plan for adaptation…and quite frankly we are waiting for approaches and methods based on good science for developing usable information and data
Climate Adaptation Planning Identify critical performance measures Identify predominant climate change trends and factors for region Identify critical assets in the network Identify impact of these changes on local environmental conditions Conduct risk appraisal of vulnerabilities and environmental changes Identify vulnerabilities of highway system to these changing conditions Identify trigger levels Assess feasibility and cost effectiveness of adaptation strategies Network Functions Asset A Asset B Asset C Asset X Change design standards Change operating strategies Change maintenance practices Change construction practices Etc. Apply triggers Identify affected highway agency functions