Download
1 / 15
150 likes | 274 Views
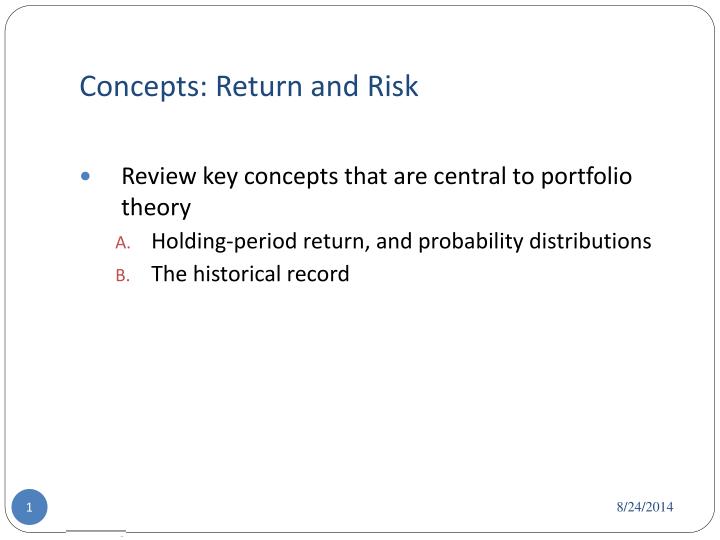
Concepts: Return and Risk. Review key concepts that are central to portfolio theory Holding-period return, and probability distributions The historical record. A. Holding Period Return (HPR). HPR = Holding Period Return P 0 = Price at the beginning of the period

E N D
Concepts: Return and Risk • Review key concepts that are central to portfolio theory • Holding-period return, and probability distributions • The historical record
A. Holding Period Return (HPR) • HPR = Holding Period Return • P0 = Price at the beginning of the period • P1 = Price at the end of the period • D1 = Dividend or interest received during the period
HPR Example Ending Price = 48 Beginning Price = 40 Dividend = 2
Characteristics of Probability Distributions Moments of a probability distribution e.g., distribution of stock returns 1) Mean: most likely value 2) Variance/standard deviation: dispersion from the mean 3) Skewness e.g., is the distribution centered? 4) Kurtosis e.g., fat tails? * If a distribution is “normal”, it can be completely described by its first two moments
Measuring the Mean • Expected return • S = number of possible outcomes or “states of nature, i” • pi = probability that outcome ‘i’ will occur • ri = return if outcome ‘i’ occurs
Numerical example E(r) = (.1)(-.05)+(.2)(.05)...+(.1)(.35) E(r) = .15 = 15%
Measuring Variance or Dispersion of Returns • Standard deviation = variance 1/2 • Using our example: • 2= [(0.1)(-0.05 - 0.15)2+(0.2)(0.05 - 0.15)2+…] = 0.01199 • = [0.01199]1/2 = 0.1095 = 10.95%
Sample Statistics • What we just looked at were the moments of a probability distribution • Before any realizations (i.e., before the fact, or ex-ante) • Calculating moments from actual results, e.g., historical records of financial asset returns – we use sample statistics • Weights are no longer the probabilities, but a function of the sample size, N • AVERAGE and STDEV functions in Excel
Relationship between nominal and real rates • Let R = nominal rate • r = real rate • i = rate of inflation r = ?
Geometric vs. Arithmetic mean • Geometric mean • Example: 10% return in first year, 8% in second year • If arithmetic: mean = ? • If geometric: mean = √[(1+0.1)(1+0.8)] – 1 = 0.08995 Excel function: GEOMEAN (but must add one first to each return) • Relationship if distribution is normal can be approximated by: • Geometric mean = arithmetic mean – 0.52