Download
1 / 38
380 likes | 516 Views
The Joy of GRID: Geomorphology and Hydrology in GIS. Finn Krogstad UW Forest Engineering http://students.washington.edu. x. x 0 ,z 0. x 1 ,z 1. x 2 ,z 2. x 4 ,z 4. x 3 ,z 3. z. Consider Sediment Routing. Times Change. Spatial problems used to require lots of programming.

E N D
The Joy of GRID:Geomorphology and Hydrology in GIS Finn Krogstad UW Forest Engineering http://students.washington.edu
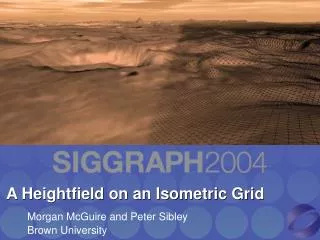
x x0,z0 x1,z1 x2,z2 x4,z4 x3,z3 z Consider Sediment Routing
Times Change • Spatial problems used to require lots of programming. • With modern spreadsheets, we could assign it as an undergraduate homework problem. • GRID offers the same spreadsheet simplicity and functionality, but handles spatial issues for you.
OUTLINE A. GRID BASICS 1. GIS Data 2. Thinking in GRID 3. Programming B. HYDROLOGIC PROCESSES 1. Local 2. Watershed C. ANALYSIS 1. Classification 2. Regression
GRID BASICS - GIS Data • Points
GRID BASICS - GIS Data • Points • Arcs • Polygons
GRID BASICS - GIS Data • Points • Arcs • Polygons • Attribute Tables
GRID BASICS - GIS Data • Points • Arcs • Polygons • Attribute Tables • Data Sources
continuous discrete GRID BASICS - Thinking in GRID • GRID-ing the World
GRID BASICS - Thinking in GRID • GRID-ing the World • Grid Algebra
GRID BASICS - Thinking in GRID • GRID-ing the World • Grid Algebra • Spatial Spreadsheet - not mysterious - intuitiveness - flexible
GRID BASICS - Programming • Command Line • just like you type it • Flow Control • if, do, while • User Interface • for GIS novices, e.g. SEDMODL
Hydrologic Processes • Local • Slope, Aspect, Curvature Z = Ax2y2 + Bx2y + Cxy2 + Dx2 + Ey2 + Fxy + Gx + Hy + I
Hydrologic Processes • Local • Slope, Aspect, Curvature • Hillshade • Display Topography • Radiant Energy • Other things
Hydrologic Processes • Local • Slope, Aspect, Curvature • Hillshade • Watershed
Hydrologic Processes • Local • Watershed • Flow direction • Lowest Neighbor • Gradient
Hydrologic Processes • Local • Watershed • Flow direction • Flow accumulation • Upslope Area • Streams • Watersheds • Variable Inputs • Cumulative Impact
Hydrologic Processes • Local • Watershed • Flow direction • Flow accumulation • Flow length • distance to stream • transport ‘friction’ • delivery to streams
Multivariate Analysis • Clustering Bands 1,4,7 ‘True’ color
Scatter Plots • Clustering image Scatter-plots
Stand cover Cluster Training • Clustering Image
Stream cover Cluster Training • Clustering Image
Water bodies Cluster Training • Clustering Image
Classification Image Classification Image
Classification vs. End Member Classification - We can classify a cell according to which class gives a higher likelihood. End Member - The fraction of each end member can be approximated by saving the normalized likelihoods.
E(precip) = a0+ a1longitude + a2elevation Multivariate Analysis • Clustering • Regression • Linear Ey = a0+ a1x1 + a2x2 + a3x3 + ....
Landslide Probability L-0.0018 M-0.0026 H-0.0037 Multivariate Analysis • Clustering • Regression • Linear Ey = a0+ a1x1 + a2x2 + a3x3 + .… • Logistic Ey=1/(1+(exp(-(a0+alxl+a2x2+a3x3+...))) E(LS)=1/(1+(exp(-(a0+alSMORPH)))
Conclusions • GRID should be used like Excel • Get yourself a wonk • Keep up on data sources • Use models to predict results • Use observations to improve models
Instructors Finn Krogstad Peter Schiess
Schedule Lecture: Tuesday, 9:30-11:20, in BLD 261 Lab: Thursday, 9:30-11:20, in BLD 261 move?
Readings Cell-based Modeling with Grid Assigned readings to follow
Grading FE423: 50% labs, 50% exam FE523: 33% labs, 33% exam, 33% project
Final Exam 10:30-12:20 p.m. Wednesday, Mar. 15, 2000 open books, open notes, pencil-and-paper solution/discussion of several problems.
Labs Post lab reports on their web site Grading will be based on communication Finished and posted one week after assigned. Late work will be accepted with half the points deduced for each week it is late. Revise and resubmit each lab.
FE523 Project A course related project of your choosing. 1/20 Proposal 2/24 Progress Report 3/15 Final Report