Download
1 / 31
320 likes | 706 Views
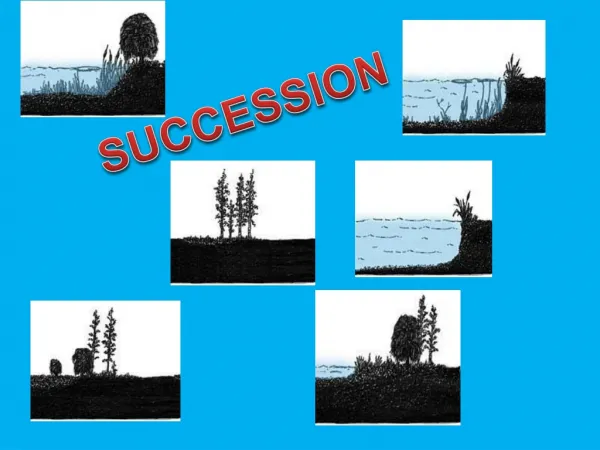
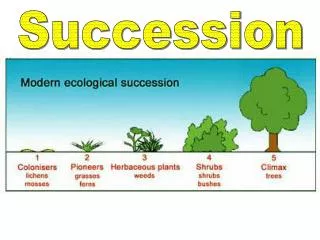
Activity 5.3 - Succession. Click here to play the interactive tutorial on succession. Click the next button to view the ‘Succession on coal mining spoil heaps’ task. Succession on coal mining spoil heaps.

E N D
Activity 5.3 - Succession Click hereto play the interactive tutorial on succession. Click the next button to view the ‘Succession on coal mining spoil heaps’ task.
Succession on coal mining spoil heaps This Powerpoint activity allows you to view the regeneration of plant cover on three spoil heaps of different ages. The spoil heaps are in Pwlldu near Abergavenny. http://www.panoramio.com/photo/4132571
Task Your task is to analyse the abiotic and biotic data on the three coal mining spoil heaps of different ages. You will then summarise the differences, and describe the changes as succession takes place. Click the information button for more detailed information about the task.
This map shows 3 spoil heaps at Pwlldu (A, B and C). The waste was dumped at different times in the past, and the age of each is shown in the key. Click on a thumbnail at the top of the screen to see more detail of the area. A B C
Soil data Click on each of the spoil heaps (A, B, C) in turn to analyse the area in detail. Click on the information button to get full instructions. Click Home to return to this page. Data entry A Click on the data entry button to enter data into a spreadsheet. Click on the soil data button to see the abiotic data. B C
Soil data 32 years old Quadrat 1 Data entry Key to species Click on thumbnails
Soil data Data entry Key to species Click on thumbnails 32 years old Quadrat 2
Soil data Data entry Key to species Click on thumbnails 32 years old Quadrat 3
Soil data Data entry Key to species Click on thumbnails 32 years old Quadrat 4
Soil data Data entry Key to species Click on thumbnails 32 years old Quadrat 5
Soil data Data entry Key to species Click on thumbnails 60 years old Quadrat 1
Soil data Data entry Key to species Click on thumbnails 60 years old Quadrat 2
Soil data Data entry Key to species Click on thumbnails 60 years old Quadrat 3
Soil data Data entry Key to species Click on thumbnails 60 years old Quadrat 4
Soil data Data entry Key to species Click on thumbnails 60 years old Quadrat 5
Soil data Data entry Key to species Click on thumbnails 145 years old Quadrat 1
Soil data Data entry Key to species Click on thumbnails 145 years old Quadrat 2
Soil data Data entry Key to species Click on thumbnails 145 years old Quadrat 3
Soil data Data entry Key to species Click on thumbnails 145 years old Quadrat 4
Soil data Data entry Key to species Click on thumbnails 145 years old Quadrat 5
Click Esc to enter data Soil data
Soil data Sheep’s fescue Data entry
Soil data Heather Data entry
Soil data Cross-leaved heath Data entry
Soil data Sphagnum Data entry
Soil data Soft rush Data entry
Soil data Reindeer moss Data entry
Soil data Bilberry without leaves Data entry
Soil data Bilberry with leaves Data entry
Instructions Soil data Use the 5 quadrats at each spoil tip site to make estimates of percentage cover of each plant, of plant cover in general, and ‘bare ground’. Record your results for percentage cover on the downloadable spreadsheet, or on the slide provided in this presentation. Finally, by clicking on the soil data button you can see some information about the soils on each tip. Use the combined information, this presentation and any additional slides with text and visuals (e.g. graphs and diagrams) you wish to create to summarise the changes to vegetation on the soil tips over time. Your presentation should answer the question ‘What are the likely changes and timeline for natural restoration of coal mining spoil tips?’ Data entry
Soil data Data entry A B C