Download
1 / 49
490 likes | 491 Views
Learn about acceleration, velocity, and motion of objects. Explore velocity-time graphs and how to calculate average and instantaneous acceleration.

E N D
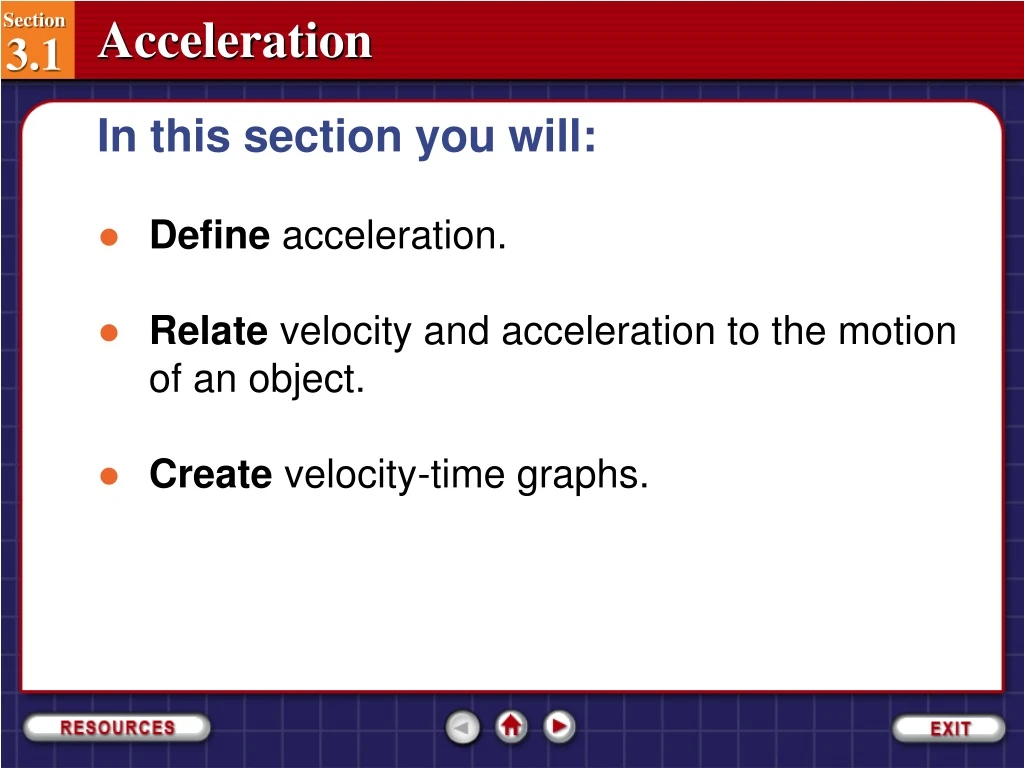
In this section you will: • Define acceleration. • Relate velocity and acceleration to the motion of an object. • Create velocity-time graphs. Section 3.1-1
Changing Velocity You can feel a difference between uniform and nonuniform motion. When you move in a nonuniform motion, you feel pushed or pulled. In contrast, when you are in uniform motion and your eyes are closed, you feel as though you are not moving at all. Section 3.1-2
Changing Velocity Consider the particle-model motion diagram below showing the distance between successive positions. Section 3.1-3
Changing Velocity There are two major indicators of the change in velocity in this form of the motion diagram. The change in the spacing of the dots and the differences in the lengths of the velocity vectors indicate the changes in velocity. Section 3.1-4
Changing Velocity If an object speeds up, each subsequent velocity vector is longer. If the object slows down, each vector is shorter than the previous one. Section 3.1-5
Changing Velocity Both types of motion diagrams give an idea of how an object’s velocity is changing. Section 3.1-6
Velocity-Time Graphs Click image to view the movie. Section 3.1-7
Velocity-Time Graphs The rate at which an object’s velocity changes is called the acceleration of the object. When the velocity of an object changes at a constant rate, it has a constant acceleration. Section 3.1-8
Average and Instantaneous Acceleration The average acceleration of an object is the change in velocity during some measurable time interval divided by that time interval. Average acceleration is measured in m/s2. The change in velocity at an instant of time is called instantaneous acceleration. Section 3.1-9
Average and Instantaneous Acceleration The instantaneous acceleration of an object can be found by drawing a tangent line on the velocity-time graph at the point of time in which you are interested. The slope of this line is equal to the instantaneous acceleration. Section 3.1-10
Displaying Acceleration on a Motion Diagram For a motion diagram to give a full picture of an object’s movement, it also should contain information about acceleration. This can be done by including average acceleration vectors. These vectors will indicate how the velocity is changing. To determine the length and direction of an average acceleration vector, subtract two consecutive velocity vectors. Section 3.1-11
Displaying Acceleration on a Motion Diagram You will have: Δv = vf - vi = vf + (-vi). Then divide by the time interval, Δt. The time interval, Δt, is 1 s. This vector, (vf - vi)/1 s, shown in violet, is the average acceleration during that time interval. Section 3.1-12
Displaying Acceleration on a Motion Diagram The velocities vi and vf refer to the velocities at the beginning and end of a chosen time interval. Section 3.1-13
Velocity and Acceleration How would you describe the sprinter’s velocity and acceleration as shown on the graph? Section 3.1-14
Velocity and Acceleration Step 1: Analyze and Sketch the Problem Section 3.1-15
Velocity and Acceleration From the graph, note that the sprinter’s velocity starts at zero, increases rapidly for the first few seconds, and then, after reaching about 10.0 m/s, remains almost constant. Section 3.1-16
Velocity and Acceleration Identify the known and unknown variables. Known: v = varies Unknown: a = ? Section 3.1-17
Velocity and Acceleration Step 2: Solve for the Unknown Section 3.1-18
Velocity and Acceleration Draw a tangent to the curve at t = 1.0 s and t = 5.0 s. Section 3.1-19
Velocity and Acceleration Solve for acceleration at 1.0 s: Section 3.1-20
Velocity and Acceleration The slope of the line at 1.0 s is equal to the acceleration at that time. Section 3.1-21
Velocity and Acceleration Solve for acceleration at 5.0 s: Section 3.1-22
Velocity and Acceleration The slope of the line at 5.0 s is equal to the acceleration at that time. Section 3.1-23
Velocity and Acceleration The acceleration is not constant because it changes from 3.4 m/(s2) at 1.0 s to 0.03 m/(s2) at 5.0 s. The acceleration is in the direction chosen to be positive because both values are positive. Section 3.1-24
Velocity and Acceleration Step 3: Evaluate the Answer Section 3.1-25
Velocity and Acceleration Are the units correct? Acceleration is measured in m/s2. Section 3.1-26
Velocity and Acceleration Step 1: Analyze and Sketch the Problem Step 2 Solve for the Unknown Draw a tangent to the curve at t = 1.0 s and t = 5.0 s. Solve for acceleration at 1.0 s. Solve for acceleration at 5.0 s. The steps covered were: Section 3.1-27
Velocity and Acceleration Step 3: Evaluate the Answer The steps covered were: Section 3.1-28
Positive and Negative Acceleration These four motion diagrams represent the four different possible ways to move along a straight line with constant acceleration. Section 3.1-29
Positive and Negative Acceleration The first motion diagram shows an object moving in the positive direction and speeding up. The second motion diagram shows the object moving in the positive direction and slowing down. Section 3.1-30
Positive and Negative Acceleration The third shows the object speeding up in the negative direction. The fourth shows the object slowing down as it moves in the negative direction. Section 3.1-31
Positive and Negative Acceleration In the first and third situations when the object is speeding up, the velocity and acceleration vectors point in the same direction in each case. In the other two situations in which the acceleration vector is in the opposite direction from the velocity vectors, the object is slowing down. Section 3.1-32
Positive and Negative Acceleration In other words, when the object’s acceleration is in the same direction as its velocity, the object’s speed increases. When they are in opposite directions, the speed decreases. Both the direction of an object’s velocity and its direction of acceleration are needed to determine whether it is speeding up or slowing down. Section 3.1-33
Positive and Negative Acceleration An object has a positive acceleration when the acceleration vector points in the positive direction, and a negative acceleration when the acceleration vector points in the negative direction. The sign of acceleration does not indicate whether the object is speeding up or slowing down. Section 3.1-34
Determining Acceleration from a v-t Graph Velocity and acceleration information is also contained in velocity-time graphs. Graphs A, B, C, D, and E, as shown on the right, represent the motions of five different runners. Section 3.1-35
Determining Acceleration from a v-t Graph Assume that the positive direction has been chosen to be east. Section 3.1-36
Determining Acceleration from a v-t Graph The slopes of Graphs A and E are zero. Thus, the accelerations are zero. Both Graphs A and E show motion at a constant velocity — Graph A to the east and Graph E to the west. Section 3.1-37
Determining Acceleration from a v-t Graph Graph B shows motion with a positive velocity. The slope of this graph indicates a constant, positive acceleration. Section 3.1-38
Determining Acceleration from a v-t Graph Graph C has a negative slope, showing motion that begins with a positive velocity, slows down, and then stops. This means that the acceleration and velocity are in opposite directions. Section 3.1-39
Determining Acceleration from a v-t Graph The point at which Graphs C and B cross shows that the runners’ velocities are equal at that point. It does not, however, give any information about the runners’ positions. Section 3.1-40
Determining Acceleration from a v-t Graph Graph D indicates movement that starts out toward the west, slows down, and for an instant gets to zero velocity, and then moves east with increasing speed. Section 3.1-41
Determining Acceleration from a v-t Graph The slope of Graph D is positive. Because the velocity and acceleration are in opposite directions, the speed decreases and equals zero at the time the graph crosses the axis. After that time, the velocity and acceleration are in the same direction and the speed increases. Section 3.1-42
Determining Acceleration from a v-t Graph The following equation expresses average acceleration as the slope of the velocity-time graph. Average acceleration is equal to the change in velocity, divided by the time it takes to make that change. Section 3.1-43
Question 1 Which of the following statements correctly defines acceleration? A. Acceleration is the rate of change of displacement of an object. B. Acceleration is the rate of change of velocity of an object. C. Acceleration is the amount of distance covered in unit time. D. Acceleration is the rate of change of speed of an object. Section 3.1-44
Answer 1 Reason:The rate at which an object’s velocity changes is called acceleration of the object. Section 3.1-45
Question 2 What happens when the velocity vector and the acceleration vector of an object in motion are in the same direction? A. The acceleration of the object increases. B. The speed of the object increases. C. The object comes to rest. D. The speed of the object decreases. Section 3.1-46
Answer 2 Reason:When the velocity vector and the acceleration vector of an object in motion are in the same direction, the speed of the object increases. Section 3.1-47
Question 3 On the basis of the velocity-time graph of a car moving up a hill, as shown on the right, determine the average acceleration of the car? A. 0.5 m/s2 B. -0.5 m/s2 C. 2 m/s2 D. -2 m/s2 Section 3.1-48
Answer 3 Reason:Average acceleration of an object is the slope of the velocity-time graph. Section 3.1-49