Download
1 / 59
590 likes | 612 Views
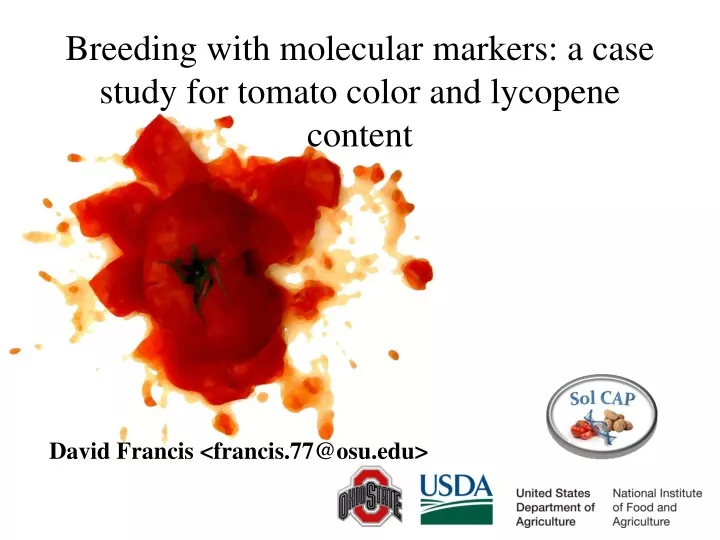
Breeding with molecular markers: a case study for tomato color and lycopene content. David Francis <francis.77@osu.edu>. Case study Measuring traits, heritability and gain under selection Developing markers for “candidate genes”

E N D
Breeding with molecular markers: a case study for tomato color and lycopene content David Francis <francis.77@osu.edu>
Case study Measuring traits, heritability and gain under selection Developing markers for “candidate genes” Estimating the proportion of phenotypic variance explained by a marker (related to concept of heritability) Demonstrate where to apply markers in a breeding program: relative efficiency of selection Select for candidate genes Select for elite background “background selection”.
Measuring traits: Color • Color correlates with lycopene and beta carotene content. Beta carotene is a nutrient. • Color uniformity determines product grade and grower premium. • Color disorders (e.g. YSD) reduce color uniformity, price and nutritional quality. Fresh-market Processed
Plant Breeding is predominantly “phenotype” based We select on the basis of traits Growers buy varieties on the basis of trait performance Measuring traits is therefore really important
Breeding programs have populations at all stages Later generations (fixed) Early generation (not fixed)
Review: inbreeding drives individuals toward homozygosity. A population of inbred lines can be replicated because seed from each plant in a line are identical. Frequency of heterozygotes (Cc) and homozygotes (CC+cc) in each generation of selfing a hybrid (F1). Freq CC = p2 + pqF Freq Cc = 2pq (1-F) Freq cc = q2 + pqF
Measuring Traits Often a balance between accuracy and efficiency of data collection
Measuring traits: Objective measures of color WhiteL Lightness Yellow Red a* Green Blue b* Chromaticity coordinates Minolta CR-300 Black
Phenotyping from digital images: fast and objective: Tomato Analyzer (Brewer et al., Plant Physiology, 2006, 141, 15-25; Darrigues et al., JASHS, 2008, 133, 579-586)
Tomato Tomato Analysis of color from Scanned images is consistent with colorimeter measurements and visual observations Rank 1: Rank 216:
We can measure the genetic contribution to a trait (heritability) at different stages using different techniques Estimate heritability on a line-mean basis using ANOVA Estimate heritability from parent/offspring regression
Estimating heritability using variance estimates from ANOVA Source Expected MS gen Var(Error)+pVar(rep*gen)+qVar(year*gen) +(p-1)(q-1)Var(gen) rep Var(Error)+nVar(year*rep)+pVar(rep*gen) + (n)(p-1)Var(rep) year Var(Error)+nVar(year*rep)+qVar(year*gen) +(p-1)(q-1)Var(year) year*gen Var(Error) + q Var(year*gen) rep*gen Var(Error) + p Var(rep*gen) year*rep Var(Error) + n Var(year*rep) gen*year*rep Var(Error) To estimate Var(Gen) use MS from ANOVA and solve. e.g. for 2 rep, 2 year trial: 13.601 = Var(Error) + 2 Var(rep*gen) + 2 Var(year*gen) + 4 Var(gen) 2.6926 = Var(Error) + 2 Var(year*gen) 10.9084 = 2 Var(rep*gen) + 4 Var(gen) 3.4639 = 2 Var(rep*gen) + 2.77724 7.447 = 4 Var(gen) - 2.77724 10.22174 = 4 var(gen) 2.55 = var(gen) = 2(G) h2 = [2(G)]/ [2(G) + 2ge/e + 2error/r*e]
Objective data from parents, offspring, and/or replicated trials allows us to estimate the genetic contribution to observed variation in a trait (heritability h2 =Vadditive genetic/ Vtotal) Expected and realized gain under selection is a function of heritability, the phenotypic variance in a population, and the selection differential (K) in standard deviation units. Heritability can be estimated from parent-offspring regression or from variance partitioning (ANOVA) Heritability for color increased with objective measurement. Heritability for color increased when selection is based on a line or family across locations and years Trait individual line or family L 0.11 0.57 Hue 0.07 0.39
X selected X unselected Hue difference (within fruit) ΔG = h2(σP)K
Selection progress: reduction in within fruit variation (hue difference w/in fruit) ML Trial Selections Introgression populations
Take home message: Score traits objectively on a quantitative scale whenever possible (improved measurement often means higher heritability). Selection (K) is in standard deviation units relative to the population (σP). Estimate heritability and realized gain at different stages of a breeding program. Measure progress.
Tomato Genetic marker data Establish marker-trait association (linkage) Trait data • How can markers help make breeding more “efficient”? • Identifying markers • Using markers for selection
How do I identify markers linked to a trait? Random approach (high density mapping). “Candidate gene” approach. DEFINITION of candidate gene: A gene suspected of being involved in the expression of a trait. Based on location Based on presumed function (biochemical pathway, annotation, etc…) Based on expression patterns
Carotenoid Biosynthesis: Candidate pathway for genes that affect color and color uniformity. Disclaimer: this is not the only candidate pathway…
Databases that link pathways to genes http://www.arabidopsis.org/help/tutorials/aracyc_intro.jsp
Databases that link pathways to genes http://metacyc.org/ http://www.plantcyc.org/ http://sgn.cornell.edu/tools/solcyc/ http://www.arabidopsis.org/biocyc/index.jsp http://www.arabidopsis.org/help/tutorials/aracyc_intro.jsp External Plant Metabolic databases CapCyc (Pepper) (C. anuum) CoffeaCyc (Coffee) (C. canephora) SolCyc (Tomato) (S. lycopersicum) NicotianaCyc (Tobacco) (N. tabacum) PetuniaCyc (Petunia) (P. hybrida) PotatoCyc (Potato) (S. tuberosum) SolaCyc (Eggplant) (S. melongena)
Check boxes (Note: MetaCyc has many more choices, but no plants)
Capsicum annum sequence retrieved Scroll down page
Using distributed resources (MetaCyc, NCBI, BLAST) we identified candidate genes, chromosomal locations, and polymorphisms. Query CCACCACCATCCTCACTTTAACCCACAAATCCCACTTTCTTTGGCCTAATTAACAATTTT |||||||||||||||||||||||||||||||||| ||||||||||||||||||||||||| Sbjct CCACCACCATCCTCACTTTAACCCACAAATCCCATTTTCTTTGGCCTAATTAACAATTTT Zeaxanthin epoxidase Probable location on Chromosome 2 Alignment of Z83835 and EF581828 reveals 5 SNPs over ~2000 bp
Genus specific database SGN Organized by ‘ontology’ 51 annotated loci
Candidates identified in other databases are here Information missing from other databases is here…
Comment on the databases: Information is not always complete/up to date. Display is not always optimal, and several steps may be needed to go from pathway > gene > potential marker. Sequence data has error associated with it. eSNPs are not the same as validated markers. Germplasm data may also have error (e.g. PI 128216) There is a wealth of information organized and available.
The previous example detailed how we might identify sequence based markers for trait selection. Query CCACCACCATCCTCACTTTAACCCACAAATCCCACTTTCTTTGGCCTAATTAACAATTTT |||||||||||||||||||||||||||||||||| ||||||||||||||||||||||||| Sbjct CCACCACCATCCTCACTTTAACCCACAAATCCCATTTTCTTTGGCCTAATTAACAATTTT Improving efficiency of selection in terms of 1) relative efficiency of selection, 2) time, 3) gain under selection and 4) cost will benefit from markers for both forward and background selection. Remainder of Presentation will focus on Where to apply markers in a program Forward and background selection Marker resources Alternative population structures and size
Establishing linkage between a “marker” and “trait” Analysis is conceptually simple (t-test; ANOVA; regression) In practice, more complex statistical models are adopted such that missing data is tolerated, significance level is accurately estimated, etc...
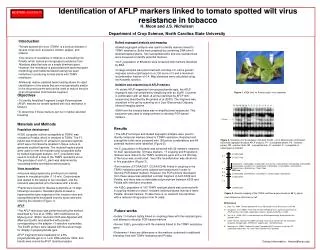
Example: QTL for color uniformity in elite crosses Audrey Darrigues, Eileen Kabelka
How much phenotypic variation is explained by a QTL? Analogous to the concept of “heritability” (variation due to genetics/total variation). Two approaches to estimate: From ANOVA: Vmarker/Vtotal From regression: r2 r2 for marker is dependent on two things: the strength of the linked gene and linkage distance. Therefore r2 can be increased by identifying markers closer to the QTL or gene of interest.
Source DF Expected MS Genotypes N-1 2 + b2(G) Marker 1 2 + b[2(GQTL) + 4r(1-r)g2] + bc(1 –2r)2g2 Gen(marker) N-2 2 + b[2(GQTL) + 4r(1-r)g2] Error N(b-1) 2 b is the number of replicates r is the recombination separating the marker from the QTL c is a coefficient related to the population size c = N – (n12 + n22)/N (n1 + n2 = 1; representing the number in each marker class) g is the genetic effect (in BC pop’s additive and dominance effects are confounded). 2(GQTL) is the part of the error variance that cannot be explained by the QTL. Vmarker/Vtotal
F-test for significance is Marker/Gen(marker) = bc(1 –2r)2g2 Significance depends on population size, recombination, the strength of the genetic effect relative to the error variance and the part of the error variance that cannot be explained by the QTL
The proportion of variance explained by polymorphic marker on chromosome 2 Trait Vm/VT L 0.25 Hue 0.15 L uniformity 0.28 Hue uniformity 0.32
Marker assisted selection is a form of indirect selection Selection for tv Selection for dg dg
MAS is a form of indirect selection: The relative efficiency of selection can be expressed as = r(gen){Hindirect/Htrait} Hindirect marker or indirect phenotype (proportion of accurate genotypes when scoring a marker) Htrait Heritability of the trait r(gen) Genetic covariance for traits. r(gen) for a marker and a phenotypic trait = Var(marker)/Var(Total) or r(marker-trait)