Download
1 / 9
90 likes | 97 Views
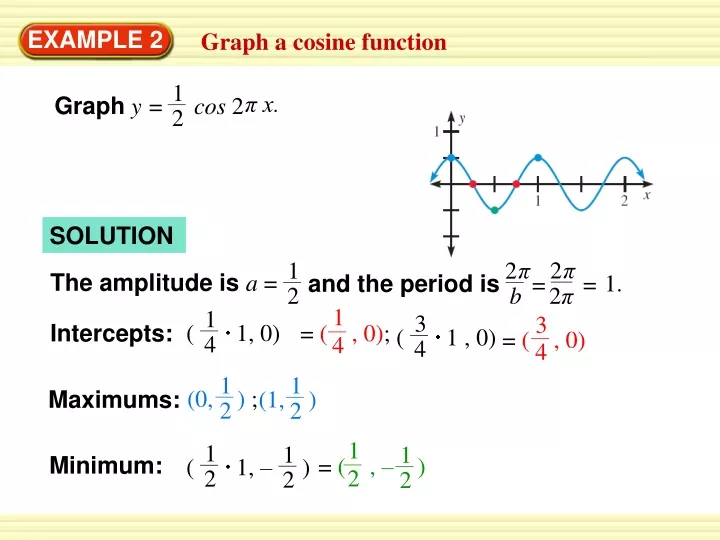
π x. Graph y = cos 2. π. 2. π. 2. =. =. b. 2 π. 1. 1. 3. 1. 1. 1. 1. ( 1, 0). = ( , 0) ;. 4. The amplitude is a =. 1. and the period is. 2. 2. 2. 4. 2. 4. ( 1 , 0). ( 1, – ). 3. Intercepts:. = ( , 0). 4. 1. 1. 2.

E N D
π x. Graphy = cos 2 π 2 π 2 = = b 2π 1 1 3 1 1 1 1 ( 1, 0) = ( , 0); 4 The amplitude is a = 1. and the period is 2 2 2 4 2 4 ( 1 , 0) ( 1, – ) 3 Intercepts: = ( , 0) 4 1 1 2 (0, ) ; Maximums: (1, ) 2 1 1 Minimum: = ( , – ) 2 2 EXAMPLE 2 Graph a cosine function SOLUTION
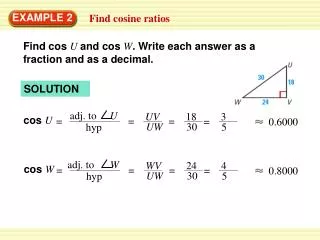
Audio Test A sound consisting of a single frequency is called a pure tone. An audiometer produces pure tones to test a person’s auditory functions. Suppose an audiometer produces a pure tone with a frequency fof 2000 hertz (cycles per second). The maximum pressure Pproduced from the pure tone is 2 millipascals. Write and graph a sine model that gives the pressure Pas a function of the time t(in seconds). EXAMPLE 3 Model with a sine function
1 b π 4000 = b 2000 = π 2 frequency = period EXAMPLE 3 Model with a sine function SOLUTION Find the values of aand bin the model P = asinbt. The maximum pressure is 2, so a = 2. You can use the frequency fto find b. STEP 1 The pressure Pas a function of time tis given by P = 2sin4000πt.
Graph the model. The amplitude is a = 2 and the period is = 3 1 1 1 2 f 4 4 1 ( , 2) ( , 0) ( , –2) (0 , 0); Intercepts: = ( , 0) ; 1 1 1 1 4000 ( , 0) 2000 2000 2000 2000 1 Maximum: = ( , 2) 1 8000 2000 Minimum: 3 = ( , –2) 8000 EXAMPLE 3 Model with a sine function STEP 2
5. y = sinπx 1 4 for Examples 2 and 3 GUIDED PRACTICE Graph the function. SOLUTION
Graph the function. 6. y = cosπx 1 3 for Examples 2 and 3 GUIDED PRACTICE SOLUTION
for Examples 2 and 3 GUIDED PRACTICE Graph the function. 7. f (x) = 2 sin 3x SOLUTION
Graph the function. 8. g(x) = 3 cos 4x for Examples 2 and 3 GUIDED PRACTICE SOLUTION
9. What If ? In Example 3, how would the function change if the audiometer produced a pure tone with a frequency of 1000 hertz? for Examples 2 and 3 GUIDED PRACTICE SOLUTION The period would increase because the frequency is decreasedp = 2 sin 2000πt