Download
1 / 20
220 likes | 321 Views
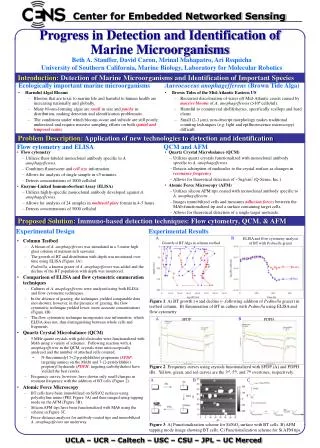
PROGRESS IN SAR SHIP DETECTION AND WAKE ANALYSIS. J.K.E. Tunaley London Research and Development Corporation, 114 Margaret Anne Drive, Ottawa, Ontario K0A 1L0 1-613-839-7943 http://www.london-research-and-development.com/. OUTLINE. K-distribution

E N D
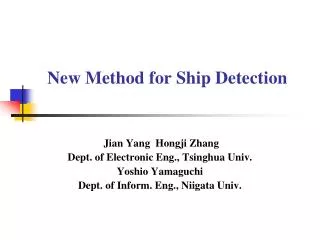
PROGRESS IN SAR SHIP DETECTION AND WAKE ANALYSIS J.K.E. Tunaley London Research and Development Corporation, 114 Margaret Anne Drive, Ottawa, Ontario K0A 1L0 1-613-839-7943 http://www.london-research-and-development.com/
OUTLINE • K-distribution • New simple asymptotic approach for large threshold values • Parameter estimation difficulties • Implications for ship detection • Ship Wakes • Study started at RMC, Kingston using RADARSAT-2 images, AIS, plus other information. • Findings and implications for MDA • See Web site for papers www.london-research-and-development.com
K-Distribution • Ships are bright blobs in SAR images • Need statistics of clutter background for CFAR • K-D excellent description of radar clutter • Basis is modulated complex Gaussian clutter • Physical / statistical basis incomplete • Modulating distribution assumed gamma • Modified Bessel functions of 2nd kind. • Computational complexity • Approximation for tail values needed www.london-research-and-development.com
K-D APPROXIMATION • Low PFA: interested in tail of distribution • Represent pdf as an integral • Use steepest descents • Accurate to better than 0.1% (PFA = 10-9) • Not sensitive to statistics of modulation • Implies that K-D has sound physical basis • Basic code can be implemented in < 18 lines of C# or C++. www.london-research-and-development.com
THRESHOLD COMPARISON www.london-research-and-development.com
PARAMETER ESTIMATION • Need to estimate mean and order parameter • Number of looks is given • Can estimate optimal performance • Uses Fisher information (Cramer Rao) • Parameter variance depends on number of independent samples, N • Need to consider bias • Note: Parameters need not be integer www.london-research-and-development.com
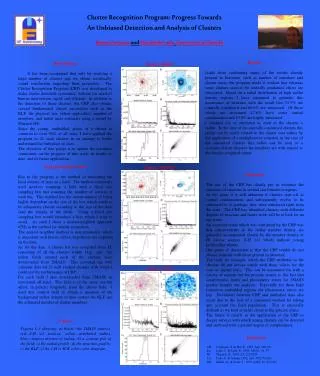
OPTIMUM MEAN INTENSITYCramer Rao Bound #Samples N = 256 L = 1 L = 4 L = 10 Spiky Rayleigh www.london-research-and-development.com
SDs USING MOM: N = 1000 Optimum Practical L = 1 Black; L = 4 Red; L = 10 Yellow www.london-research-and-development.com
PRACTICAL THRESHOLD N = 100 Ideal N = 1000 N = 10000 L = 4 Rayleigh Spiky www.london-research-and-development.com
CONCLUSIONS (1) • K-distribution approximation will reduce computational complexity for ship detection • Methodology adds support to use of K-distribution • Insensitivity to modulating distribution • Mean of K-distribution can be estimated as usual • Parameter variance may bias detection thresholds by large factors if N < 1000 • Very important in spiky clutter • Without correction, PFA may increase by orders of magnitude • If corrected, probability of ship detection is reduced • Adaptive pixel block size (N) is desirable in variable clutter www.london-research-and-development.com
SHIP WAKES • Turbulent wake study with Dan Roy at RMC • RADARSAT-2 images • AIS • Other ship information about propulsion system (Ship owners, Internet, etc.) • Analysis (60 ships) includes • Twin screws/single screw • Left/right handed screws www.london-research-and-development.com
RMC RESULTS • Wakes not usually visible when wind speed U > 6 m/s • Ship speed V is important: if U < 6 m/s && V > 5 m/s, 80% of wakes are visible • Bright line on side of wake consistent with propeller flows (swirling and axial) and wind direction • Wakes from shallow twin screws tend to be visible www.london-research-and-development.com
RSAT-2: QUEEN OF ALBERNI Data supplied by MDA Corporation www.london-research-and-development.com
Q of A Parameters www.london-research-and-development.com
COMBINED SWIRLING AND AXIAL WAKE • Consider both linear and angular momentum in propeller wake • Modify Prandtl’s approach to theory • Estimate fluid linear and angular momentum using standard engineering methods • Apply to Queen of Alberni (BC Ferries) www.london-research-and-development.com
Q of A Wake Diameter Combined Swirling Axial www.london-research-and-development.com
Queen of Alberni Maximum Surface Flow Speed Axial Swirling www.london-research-and-development.com
Deep Screw CaseMaximum Flow Speed Axial Swirling www.london-research-and-development.com
CONCLUSIONS (2) • Surface flows in the turbulent wake can be large compared with Bragg group velocity • Expect significant radar wake visibility for long distances • Swirling component dominates axial flow immediately astern and especially when screws are deep • Wake characteristics can be used to verify ship • Note: • Hydrodynamic wake width is only one factor in radar wake width. Others are flow speeds, ambient wind and waves, radar effects and geometry. www.london-research-and-development.com
END Thank You All! www.london-research-and-development.com