Download
1 / 17
170 likes | 176 Views
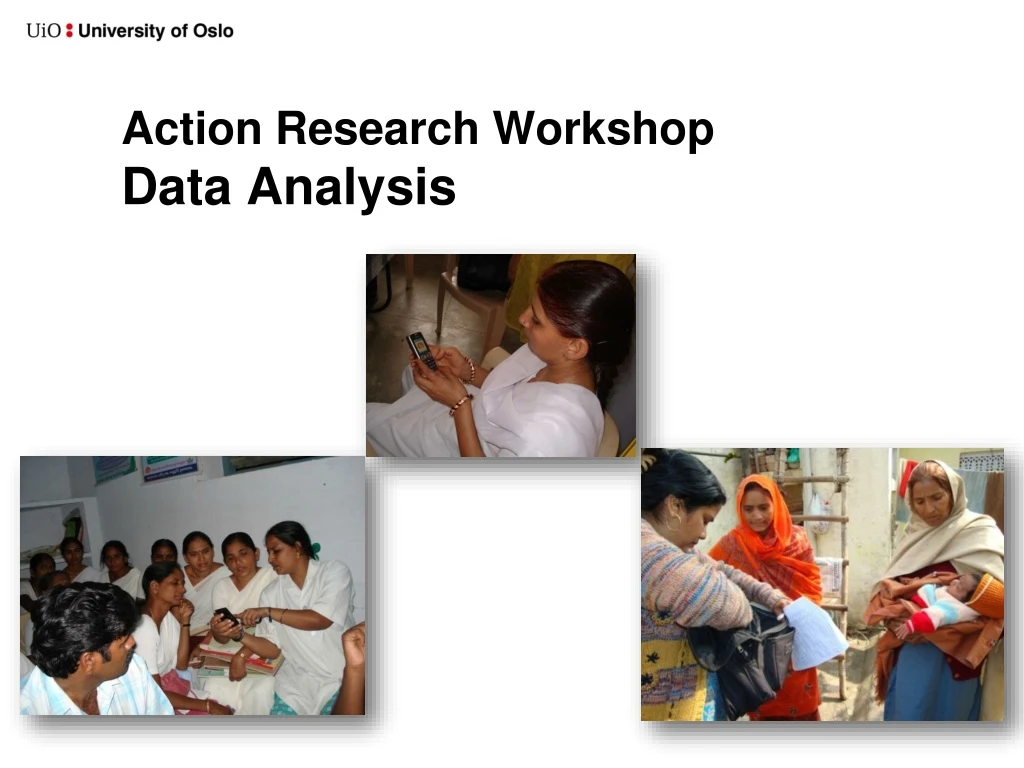
Action Research Workshop Data Analysis. Action Research Workshop: Data Analysis. Data analysis in the research process. Values, world view. Value claims. Research question. Epistemology. Knowledge claims. Research review. Discussion. Interpretations explanations. Theories.

E N D
Data analysis in the research process Values, world view Value claims Research question Epistemology Knowledge claims Research review Discussion Interpretations explanations Theories Concepts Results External validity Episte- mological lens Method Findings Data analysis Research design Constructs, variables Records Internal validity Investi- gative lens Observed events and objects Data collection
Qualitative Data Analysis • How to make sense of the “raw information” • Material is unstructured: interviews, field notes, documents, photographs... • Want to find patterns and explanations, while retaining sense of original accounts and observations • What does it all mean? • Fundamental tasks are: defining, categorising, mapping, exploring, explaining, theorising... • Will it help you to use a software package, such as Atlas TI? • Yes, it will help you to keep track of data • No, it will not do the analysis for you
Qualitative Data Analysis: Miles and Huberman Data Collection Data Display Data Reduction Conclusions: drawing/verifying
Data ReductionLadder of Analytical Abstraction 3. Identifyingpatterns and proposingexplanations 2. Identifyingthemes and trends 1. Summarizinginterviews and technicaldocuments Climbing the ladder is a process of transformation. From a validity perspective each step constitutes a threat After Carney (1990), Miles and Huberman (1994)
Key tool: Data Displays • Display: A visual format that presents information systematically, in to order to help the researcher to identify findings. • ”You know what you display” (p. 91.) • Viewing the condensed ”full data set” in one view • It is creative and fun to make good data displays! • They are also very useful in publications
Display types: Tables Orlikowski, 1993, CASE Tools as Organizational Change: Investigating Incremental and Radical Changes in Systems Development, MISQ 17(3)
Data dispays: Timelines Moens, Broerse and Munders (2008). Evaluating a participatory approach to information and communication technology development: The case of education in Tanzania. International Journal of Education and Development using ICT, 4(4).
Data displays: Networks SHEPPARD, B. & J. BROWN. " Meeting the challenge of information technology through educational partnerships: A case study ", International Electronic Journal for Leadership in Learning, 2(11), 1998.
Display types: Networks This arrived by way of Stanley Wasserman at the SOCNET Listserv (from the International Network of Social Network Analysts) – The NYT’s Social Network analysis of who Academy Awards
Data displays: Process Hagmann, J. R., E. Chuma, K. Murwira, M. Connolly, and P. Ficarelli. 2002. Success factors in integrated natural resource management R&D: lessons from practice. Conservation Ecology 5(2): 29.
Data displays:Table of events and outcomes Table 3: Summarizing the project, using DeLone and McLean's key concepts. Bygstad, B. (2003) The Implementation Puzzle of CRM Systems in Knowledge Based Organizations.Information Resources Management Journal. Nov 2003.
Data displays: Explanations Orlikowski, 1993, CASE Tools as Organizational Change: Investigating Incremental and Radical Changes in Systems Development, MISQ 17(3)
Working with data displays 8. Suggest re-analysis 6. Integrate/elaborate 4. Suggest comparisons 2. Make sense Display Findings 1. Summarize 3. See themes/patters/clusters 5. Discover relationships 7. Develop explanations After M&H fig 5.4