Download
1 / 28
290 likes | 447 Views
Alignment study. 19 /May/2010 (S. Haino). Summary on Alignment review. Inner layers are expected to be kept “almost” aligned when AMS arrives at ISS Small shifts ( 30~50 μm ) in z-direction will be possible due to (1) Change of gravity (2) Shrink of foam support

E N D
Alignment study 19/May/2010 (S. Haino)
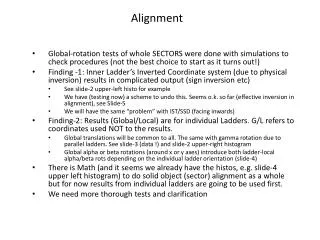
Summary on Alignment review • Inner layers are expected to be kept “almost” aligned when AMS arrives at ISS • Small shifts (30~50 μm) in z-direction will be possible due to (1) Change of gravity (2) Shrink of foam support • Momentum (or Energy) reference is needed for the absolute rigidity calibration
Alignment methods for AMS-PM • Monitoring Layer 1N/9 movement8-layer acceptance (8 Layers+ Layer 1N or 9)103~104 protons (E > 10 GV) • Incoherent alignment (ladder base alignment)Maximum acceptance (~ 0.5 m2sr)> 106 protons (E > 10 GV) • Coherent alignment (momentum calibration)9-layer +Ecal acceptance (< 0.05 m2sr)~103 e+ and ~104 e- (E > ~100 GeV)
Alignment monitoring MC data generated withGbatch/PGTRACKAlignment accuracy estimated from Gaussian fitting error on the residual of layer 1N/9 hit Proton flux weight above 10 GV Layer 1N Layer 9 dY dZ dθxy
Coherent alignment • Check of absolute alignment for outer layersby comparing Rigidity measured by Tracker (RTracker)and Energy measured by Ecal (EEcal)on high energy e+ and e- sample • Radiation energy loss makes PTracker=|RTracker| smaller w.r.t. EEcal • Alignment shift makes RTracker shifted to the opposite direction for e+ and e-
Coherent alignment - simulation • AMS-B Gbatch/PGTRACK simulation(For details please see presentation by P. Zuccon) • 108 e-and e+ each are injected in uniform Log10E distribution (10 < E < 500 GeV)isotropically from a plane 2.4m × 2.4m at Z = 1.8m Only trajectories which pass all the Tracker 9 layersare simulated • Physics switches : LOSS= 1, DRAY= 1, HADR= 0, MULS= 1,BREM= 1, PAIR= 1
Ecal energy correction • Absolute energy scale • Linearity due to the shower leak Before After
EEcal/PTracker VS Egen In case Layer 1N is shifted by ΔY = ±20 μm
Coherent alignment - simulation • Compare EEcal/PTracker distribution between RTracker > 0 and RTracker < 0for e+ and e- sample with EEcal > 80 GeV • Flux weight applied assuminge- flux tuned by Fermi/LAT datae+ flux tuned and extrapolated by Pamela dataSimulated acceptance (full Ecal) : 0.025 m2srLive data taking time : 100 days • Kolmogorov probability (P) is calculated for the compatibility of two scaled histograms with RTracker > 0 and RTracker < 0
EEcal/PTracker comparison In case Layer 1N is shifted by ΔY = ±20 μm :T = 100 days P: Kolmogorov probability P: Kolmogorov probability
-LogP VS ΔY In case Layer 1N is shifted by ΔY :T = 100 days Estimated error~5 μm
Alignment methods for AMS-PM • Monitoring Layer 1N/9 movement2~3 μm accuracy (dY) for 10 min. live time • Incoherent alignment (ladder alignment)> 106 protons (E > 10 GV) for 1~2 daysStudy in progress • Coherent alignment (momentum calibration)~5 μm accuracy for 100 days live time
Alignment difference Between Pre-int. (2008) and Flight-int. (2009) • Ext. planes seem rotating w.r.t. Int. planes by order of 100 μm/60 cm ~ 10-2degrees • A small (~50 μm) Z-shift found in Ext. planes • No significant shift found for internal layers
Alignment differencebetween Pre-int.(2008) and Flight-int.(2009) Ladder Shift (dX) Ladder Shift (dY) Ladder Shift (dZ) Ladder Rotaion (dY/dX)
Alignment with test beam • B-off runs with 400 GeV/c proton beam (4B70D0BF-4b710CBF,58 points available) are reconstructed with straight tracks • The following three parameters are tuned w.r.t. the CR alignment (2009)(1) Layer shift along z-axis : ~20 μm(2) Ladder shift along x-axis : 5~10 μm(3) Ladder shift along y-axis : 5~10 μm
Test beam alignment Ladder Shift (dX) RMS ~5 μm Ladder Shift (dY) RMS ~5 μm Layer Shift (dZ) RMS ~15 μm
Mean of (400GV)/Rigidity before alignment
Mean of (400GV)/Rigidity After alignment
Alignment study with B-off/on • The 5 alignment applied to proton TB runs • Linear fitting on B-OFF runs • Curved fitting (1/R = 0 fixed) on B-OFF runs • Curved fitting (1/R free par.) on B-OFF runs • Curved fitting (R = 400 GV fixed)on B-ON runs • Curved fitting (1/R free par.) on B-ON runs
Alignment study with AMS-01 dZ = 31±44 μm
Alignment monitoring - simulation • AMS-B Gbatch/PGTRACK simulation(For details please see presentation by P. Zuccon) • 108 protons injected in uniform Log10R distribution (1 GV < R < 10 TV)isotropically from a plane 2.4m × 2.4m at Z = 1.8m • Physics switches : LOSS= 1, DRAY= 1, HADR= 0, MULS= 1 • Alignment accuracy estimated from Gaussian fitting error on the residual of layer 1N/9 hit weighted by proton flux above 10 GV
Geometry Layer8 Layer 1N Layer 9 Ecal 65 × 65 cm2 Layer1 Layer 2,3 Layer 4,5 Layer 6,7 Layer 9
In-flight alignment: STEP 1 Step 1 Correction for random displacements of the sensors (incoherent alignment) • Done with relativistic protons • Input trajectory evaluated from (misaligned) spectrometer fit measured step 1 Flight data Simulation • After incoherent alignment: • residuals are centered • width consistent with nominal resolution + alignment uncertainty (~1mm) X side Y side protons 7-100 GV (6x6y, all plane included in the fit) Elena Vannuccini Elena Vannuccini
In-flight alignment: STEP 2 • After Step1: • (possible) uncorrected global distortions might mimic a residual deflection • spectrometer systematic effect • Step 2 Correction for global distortions of the system (coherent alignment) • Done with electrons and positrons • Energy determined with the calorimeter • DE/E < 10% above 5GeV step 1 step 2 • Energy-rigidity match • HOWEVER, the energy measured by the calorimeter can not be used directly as input of the alignment procedure, for two reasons: • Calorimeter calibration systematic uncertainty • Electron/positron Bremstrahlung above the spectrometer deflection offset calorimeter calibration uncertanty Elena Vannuccini Elena Vannuccini
Bremsstrahlung effect From Bethe-Heitler model The probability distribution of z depends on the amount of traversed material does not depend on the initial momentum it should be the same for electrons and positrons!! With real data: Spectrometer systematic gives a charge-sign dependent effect Calorimeter systematic has the same effect for both electrons and positrons * e± P0 t~0.1X0 PSpe PCal~P0 g e± Elena Vannuccini