Download
1 / 19
191 likes | 581 Views
Thinking Critically about How to Organize Texts into Visuals: Creating Infographics. Trisha Pomerville & Jennifer Huffman Wright State University. What is an Infographic?. Why We Used Infographics. How We Used Infographics. Explanation of Assignment. Pricing Strategy Presentation.

E N D
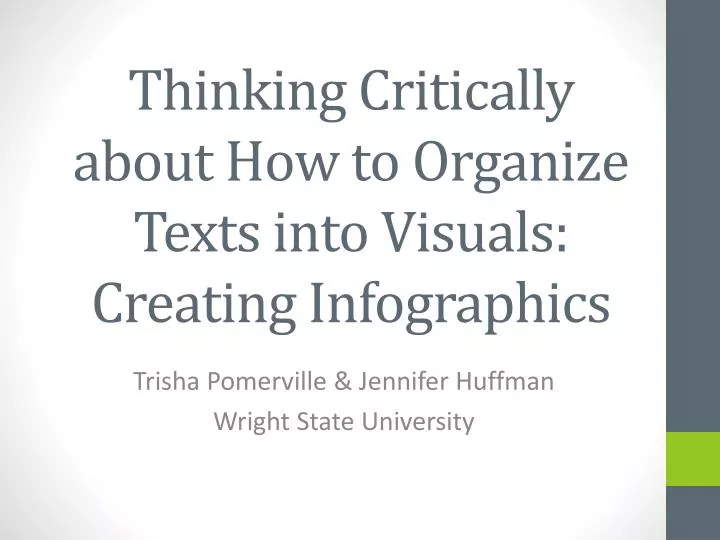
Thinking Critically about How to Organize Texts into Visuals: Creating Infographics Trisha Pomerville & Jennifer Huffman Wright State University
Explanation of Assignment Pricing Strategy Presentation Influence of Culture Presentation Key Terms: Culture Values Norms Folkways Mores, Laws & Crimes Pricing Strategy: • Market-Skimming • Market-Penetration • Captive Product • Product Bundle • Optional-Product
Assignment Guidelines • Read about the term and decide how to explain it in simple words/phrases & with visuals in an infographic. • Find a visual(s) to help explain the term in the infographic. • Microsoft Clip Art and/or Smart Art Shapes • Decide how you will organize the material in the infographic. Infographic Template 1Infographic Template 2 • Save PPT as a PNG or JPEG file. • Choose which group members will present each part. • Practice giving presentation.
Example Infographics Market Skimming Pricing(Teacher Example) Optional - Product Pricing(Student Example) Culture(Teacher Example) Value 1(Student Example) Value 2(Student Example)
Student Opinions Pricing Strategies Influence of Culture
Likes Pricing Strategies Influence of Culture Made me want to study content more; examine skills Information sticks to brain because of pictures • Made details clear to understand; “Easier than reading” • Made students think in a creative way • Helpful to prepare for tests
Dislikes Pricing Strategies Influence of Culture Think a lot when designing Some presentations not clear. Presenters must know information in order to present well. • Summarize the reading • Difficult to make • Takes a long time
Changes to Assignment Pricing Strategies Influence of Culture Add more details – more words Use different program to design – leave in PPT Need to improve skills in computer program Add funny pictures & colors to make unforgettable Add videos • Practice • More pictures/shapes • Should give to students before a test to help them do better • Start with a small reading section, then move up to a paragraph and whole subject/reading to make it easier to learn
Teacher Opinions • Incorporate different learning styles • Think creatively • Transfer ideas from readings and lectures to other contexts • Clarify and analyze the meaning of text • Organize and synthesize information from readings • Summarize information from readings • Paraphrase ideas from readings
Other Uses • Introducing a Topic • Example: Social Media • Explaining Reading & Listening Skills • Example: Organizational Structures • Explaining Grammatical Structures • Example: Modals, Prepositions • Sharing Survey or Research Results • Other Ideas?
Free Tools • Piktocharthttp://piktochart.com • Easel.ly http://www.easel.ly • Infogr.am http://infogr.am
References HubSpot. (2013). [Graph illustrations that show example infographics]. Five infographics templates in PowerPoint. http://offers.hubspot.com/how-to-easily-create-five-fabulous-infographics-in-powerpoint Krauss, J. (2012). More Than Words Can Say: InfographicsLearning & Leading with Technology 39, 10-14. Retrieved from http://www.learningandleading-digital.com/learning_leading/201202?pg=12#pg12 McMillan, N. (2012). 5 Lessons with Infographics. Retrieved from ttp://designerlessons.org/2012/04/29/esl-lesson-plan-5-lessons-with-infographics-1-thats-old-news/ NeoMan Studios. (2013). [Graph illustration about reasons to use infographics]. 13 Reasons Why Your Brain Craves Infographics. Retrieved from http://neomam.com/interactive/13reasons/ NickiLinCha (2012) [Graph illustrations of grammatical structures, idioms, etc.] Infographics for the ESL Class. Retrieved from http://www.livebinders.com/play/play?id=412294 Springfield Township High School Virtual Library (2012) A guide for English as a Second Language students: Infographic Lessons. Retrieved from http://sdst.libguides.com/content.php?pid=265291&sid=2598678 Student Experts (n.d.) [Graph illustration about infographics] Infographics. Retrieved from www.studentexperts.com


![Agile Marketing Influencer Lifecycle [INFOGRAPHIC]](https://cdn4.slideserve.com/7373381/slide1-dt.jpg)