Download
1 / 20
200 likes | 320 Views
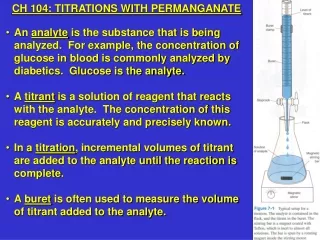
Key factors for a successful ISCO application with Permanganate. Prepared by: Richard W Lewis CPG Program Manager ERM. ISCO Treatment. Two key issues Does the reaction take place? Competing reactions Can the reagent contact the contaminant? The most critical part of the application. 3.0

E N D
Key factors for a successful ISCO application with Permanganate Prepared by: Richard W Lewis CPG Program Manager ERM
ISCO Treatment • Two key issues • Does the reaction take place? • Competing reactions • Can the reagent contact the contaminant? • The most critical part of the application
3.0 2.75 2.5 2.25 2.0 1.75 1.5 1.25 1.0 Hydroxyl Radical Persulfate Radical C-C (Sat’d) Oxidation of Organics PCBs Oxidation of Inorganics Ozone Persulfate Hydrogen Peroxide R Permanganate Bleach Chlorine gas Chlorenated- ethenes Oxygen Nitrate Reactivity of Available Oxidants
Oxidant Usage • [Oxidant]Required= • [Stoichiometric Demand]Contaminant • + [Soil Matrix Demand] • [Metals] • [Organic Carbon]Oxidizable • +[Decomposition]Oxidant
Soil Matrix Demand • Range of Values, Kg (KMnO4)/m3 Soil, US Soils • Low - 0.07 -0.2 • Average - 1 - 2 • High - 4 - 10+ • Importance of SOD • Stoichiometric Demand - TCE (for comparison) • 100 PPM Dissolved - 0.05 Kg/m3 • 100 PPM Adsorbed - 0.25 Kg/m3 • Kg KMnO4 for 30m x 30m x 7m Site • Low - 1680 Total - 0.26 Kg/m3 • Average - 16,800 Total - 2.6 Kg/m3 • High - 67,200 Total - 10.6 Kg/m3
Wells (Single Injection) Existing SVE, Monitoring, Pumping Wells 1000 - 2000 gal/well 20-40’ Radius No Depth Limit Push Tool Injection (Pressure) 50-200 gal per 5’ Interval Limited to < 70’ 5 - 15’ Radius 3-6/Day/Rig Recirculation Wells Single or Dual Limited by Lithology Limited by Sat’d Thickness Liquid Atomization Pneumatic Fracturing High Pressure N2 Atomized injection 20-40’ Radius Hydraulic Fracturing 20-40’ Radius Application Methods
Well Injection Cross Section Plan View Groundwater Groundwater
Push Tool Injection Sequential Injection
Hydraulic Fracturing Notch Bore hole Fracture Soil Inject Material
Union Chemical Superfund Site • ISCO • Pre-Treatment: CVOCs and T,X (5 – 115 mg/L) • Pilot test 1997 • Application 1998 (3,500 pounds) • Application 1999 (29,000 pounds) • Application 2000 (10,500 pounds) • Post-Treatment: CVOCs (0 – 4 mg/L) • 85-95% reduction • Allowed deactivation of P&T component • Facilitated transition to enhanced anaerobic biologic remediation • Used KMnO4 (site wide) and targeted NaMnO4 • Flow rate ~ 3 gpm @15 psi [11 l/min @ 103 kpal]
Union Chemical Superfund Site Project History 1997 (Pre ISCO) 1999 (During ISCO) 2000 (Post Treatment)
Chemical Oxidation Treatment Areas(1998, 1999 and 2000) – pounds listed is pounds of oxidant 1998 - 3,500 lbs. 1999 - 29,000 lbs. 2000 - 10,500 lbs.
TCE Concentrations (ug/L) – mineralization! Baseline Data Chemical Oxidation • SC Program • (1996 – 1998) • SVE / HAI • P&T 1998 P&T only June 1998 - Pre Oxidation October 1995 - Pre-remediation Compare maps to “footprint” of additions November 1999 April 1999 Chemical Oxidation Deactivation of P&T Post 1998 Post 1999
Former Industrial Site, Quincy, MA Pre Full-Scale – Summer 2001 • ISCO • Pilot tests • 2000 (6,500 lbs.) multiple wells and • 2001 (1,100 lbs.) various well types • Oxidant demand 1 –2 g/kg (field tests) • Full scale application 2001 • 44,700 lbs. of oxidant (as KMnO4 and NaMnO4) • Flow Rates 5 gpm @ 15 psi • Residual Targeted areas 2002 • Trench additions - 12,500 pounds • Two MWs 2002 - 1,980 pounds • Allowed deactivation of P&T component • Allowed sale of property (redevelopment) • Cost savings > $1.5M Post Full-Scale – Winter /Spring 2002
Former Industrial Site, Quincy, MA To Full Scale (2002) To Residual Treatment (2002) From Pilot (2000 and 2001)