Download
1 / 51
510 likes | 611 Views
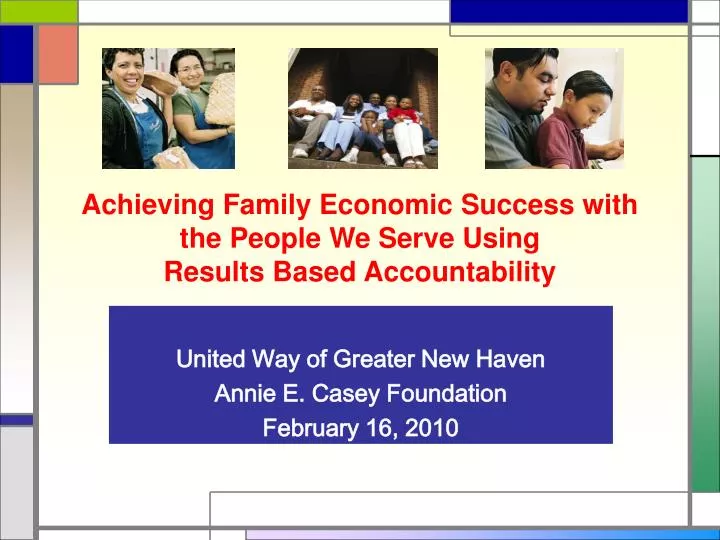
Achieving Family Economic Success with the People We Serve Using Results Based Accountability. United Way of Greater New Haven Annie E. Casey Foundation February 16, 2010. Results for Today. Can apply the fundamentals of Results Based Accountability (RBA)

E N D
Achieving Family Economic Success with the People We Serve Using Results Based Accountability United Way of Greater New Haven Annie E. Casey Foundation February 16, 2010
Results for Today • Can apply the fundamentals of Results Based Accountability (RBA) • Know the different types of and how to use performance measures in performance accountability • Are equipped to make applications to the United Way of Greater New Haven and the Casey Foundation
Various Outcome Models Balanced Scorecard Our Own Hybrid Scales and Ladders Logic ModelResults Mapping Outcome Funding Framework
AECF and UWGNH use Results Based Accountability Results Matter “It matters if we succeed or fail. It matters if things get better or worse.” Mark Friedman
Results Based Accountability a focused way of thinking and taking action that starts with ENDS (defining the change you want to make) and works backwards to the means (developing powerful strategies to bring about the change).
Why RBA Practice • Has consistent terms to use. • Uses a simple, step-by-step way to take action to make it better for populations of children, individuals or families. • Brings people together on what they care about– conditions of well-being. • Provides a common frameworkfor human services, government, funders and communities to work together. • Has a dual focus – population & program level change Common Language Common Sense Common Ground
What is the Added Value of RBA? • Draws people together on what they care about – better results for children & families • Makes the “silo” way of working obsolete because people align their actions as partners for a shared result • Uses data to inform decisions vs. the politics of the day • Uses what works vs. favorite programs to achieve results • Shares accountability across partners for better results • Tracks progress regularly by using data to course correct or to accelerate the work
RBA Practice - Language Consistency To avoid - many terms, few definitions, & interchanging Benchmark Outcome Result Modifiers Measurable Core Urgent Qualitative Priority Programmatic Targeted Performance Incremental Strategic Systemic Indicator Goal Measure Objective Target
Two Profoundly DifferentAccountabilities • PerformancePopulations • For CustomersWhole in a place or geographic area • In Jobs AgencyAll Families in the City
Common Language Population Accountability Result (Outcome) – quality of life condition Families are economically successful. Indicator– quantifies the result in the form of a percent, rate or ratio - % of residents employed
Population Accountability Whole Population + Desired Result + Place Population Accountability =
Population Accountability Whole Population Families + Desired Result Have Economic Stability + Place New Haven Population Accountability =
P O P U L A T I O N Whole Populations in a Place EX Children in Low Income Families in New Haven Result Quality of Life Change EX: Children & families achieve financial stability Indicator Trend Line Quantifies the Result EX: 60% of families are employed in 2008 & 61% in 2009 Strategies What works to change the indicator Trend Line Multi-sector jobs pipeline Program or Service Population Re-entry Residents Performance Measures (How Much, How Well, Difference Made) 120 residents in training, 70% complete training, 60 (50%) residents obtain jobs Actions to Take (Partners commit to take action) Hospital agrees to hire ex-offenders, Library sponsors a job fair, Union establishes a apprentice program R B A P E R F O R M A N C E
7 Q’s of Population Accountability • 1.Which population(s) are we concerned about? • 2. What quality of life conditions do we want for the population(s)? (results) • 3. What measures can tells us that these conditions are improving? (indicators) • 4. How are we doing on the most important indicators for all populations? • (trend line) What factors are affecting the trend line? (story behind the data)5.Which partners are needed to change the trend line?6. Which strategies based on evidence, practice or experience are powerful • enough to change the trend line?7.What actions are going to take as a group?
Shifting from PopulationAccountability to Performance Accountability
PerformanceAccountability Customers Recently released Offenders + Program Shea Services + Difference Made # retaining jobs for 6 months Performance Accountability =
Performance Accountability Is . . . An approach to help us better see the link between our workand our performance and the results achieved for the people we serve in our programs.
Performance Measures A Closer Look
Performance Measures Answer Three Questions 1.How much didwe do?(Quantity) 2. How well did we do it?(Quality) 3. Who is better off?(Impact)
How much did we do? • 1.How many did we serve? (Customers) • # of individualsserved through jobs pipeline • # of agenciesdid we refer to? 2.How many activities did we provide? • # of training sessions held • # of eventsheld in the neighborhood
How well did we do? 1. Are our efforts Timely? % of referrals completed in 24 hours 2. What are the completion or Attendance rates? % new workers completing training 3. Are our customers Satisfied? % of employers satisfied with job hires 4. What are the Costs per unit? TASCS $400 per jobs skills training session held 5. What are professional or organizational Standards? Worker to Coaches ratio (10 to 1)
What Difference Made – Better Off 1.Behaviors(#/% of participants who report to work on time) • Attitudes (Opinions)(#/% of participants who value seeking a degree) • Circumstances(#/% of participants who have a job at program completion) • Knowledge/Skills(#/% of individuals who have job increased skills) BACKS
Employment Readiness Class • How much did we do? (Quantity) • # participating in the class • How well did we do it? (Quality) • % satisfied with class Who is better off? (Impact) • #/% who get a job
How Performance Measures Fit Together How Much How Well Better Off
Performance Measures Start with Effort How hard did we try? Effect What difference did we make?
Performance Measures Look at Both Quantity Quality How well did we do it? ( % ) How much did we do? ( # )
Here is the Fit of Performance Measures Effort HowWell HowMuch We Did Eff ect
The Fit In Detail Quality Quantity How much service did we deliver? # How welldid we deliver it? % Effect Effort Better Off How much change / effect did we produce? # What quality of change / effect did we produce? %
Quality Quantity Job Skills Class # of youth participating in a jobs skills class % of youth satisfied with the program EffectEffort Is anyone better off? # of youth who have a job % of youth who have a job
Performance Measures Are NOT Equal How much did we do? How well did we do it? 2nd Most Important Least Important Is Anyone Better Off? MOST Important 3rd Most Important
Numbers Tell Only Part of the Story Numberstell you the exact “number” of participants who were better off. (Q#3) Percentages tell the degree of success of the program/organization. (Q#4) 1 2 100 job applicants in the program 40% of applicants complete course # % 4 3 50 applicants employed 50% of applicants employed # %
Measuring Improvement • Point in Time Improvement # / % of agencies showing increased results in 2008 • Point to Point Over Time # / % of agencies showing results for two years
Performance Measures: How Many Priority Measures – Most Important • 2 or 3 or 4 “Headline” Measures Secondary Measures • Others that you may want to track . . . Data Development Work to Do • Need to gather data to measure what you don’t have • Data that needs repair (definition, quality, timely)
Setting Performance Targets • Helps us understand what we are aiming for and if we don’t reach targets then we can work to discover what didn’t work and what we can do better. • Helps to answer the key questions • Is it producing what it should for its customers? • Is this program worth the money? • Can it perform better? • Can it be done less expensively?
Performance Measures Quantity Quality 1 2 What/How much did we do? # How welldid we do it? % EffectEffort 3 4 Better Off # %
What Are The Steps To Improve Our Performance?
7 Performance Accountability Questions • Who are our customers? For which program? • How do we measure if we are making a difference? (customersare better off) • How do we measure if we deliver our services well?(quality measures) • What is the data telling us about how we are doing on these measures? + the trend line – better, worse or the same? For all customer groups especially where disparities exist + story behind the data – factors pushing up & pushing down ? • Which partners are needed to change the trend line? • What actions are powerful enough to address the factors? What works based on evidence, practice or experience? • What actions are we going to take as a group?
Who are our customers? • Which program? People participating in the program or the activities to implement a strategy • children • parents
How do we measure if we are making a difference? • Ways people are “Better off” B = Behaviors Change A = Attitudes/Opinions Shift C = Circumstances are Better K = Knowledge Increased S = Skills Increased “BACKS”
How can we measure if we deliver our services well? • Quality Measures T = Timeliness of service response-delivery A = Attendance rates and programs S = Satisfaction of how well trusted C = Costs per unit or amount spent S = Standards for services, staffing, etc. “TASCS”
4.What is the data telling us about how are we doing on the performance measures? Factors decreasing trend What is the story? Trend Line ? Better ? Same ? Worse Factors increasing trend History Forecast Current
Shea Community Workforce Partner Number of Training Program Graduates with Jobs
Who are the partners? Who is contributing? Who is missing at the table? Who do we recruit to help move the work forward? Which partners can expand their efforts?
What actions are powerful enough to address the priority factors to improve the trend line? What are the priority factors that are affecting the and of the trend line? What do we think would be effective to make a difference – to improve the identified “better off” or “how well” performance measure? What do we know from evidence, practice, or our experiences?
What actions are we going to take? • What actions are we going to take? • Who is going to do what? • What is the timeline? • When will we collect the data to take stock of whether the actions are working?
The Intersection of Population&PerformanceAccountability Results Indicators Population Strategies Performance Measures for Customers Performance
The Contribution of Program Measures to Population Change Result: New Haven families achieve financial stability and security. Program Measure: # of re-entry residents employed Indicator: % of families employed New Haven Partners One Employment Partner A Training Class
Taking Action to Improve the Trend Line • Identify your Performance Measure • Draw your trend line • List the factors that increase and • decrease the trend line • Use the priority factors to identify what actions to take to improve the trend line • Report out the actions to take