Download
1 / 35
380 likes | 877 Views
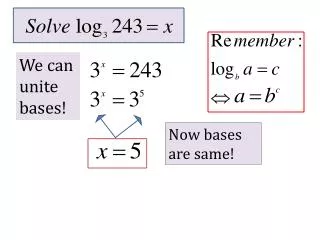
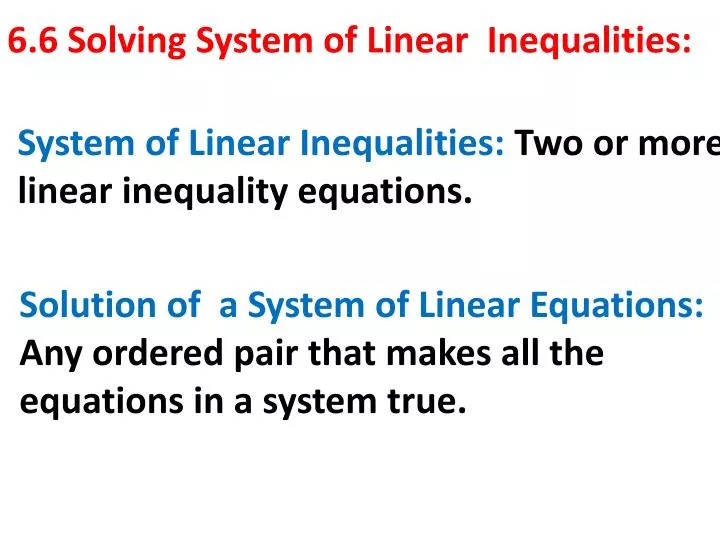
System of Linear Inequalities: Two or more linear inequality equations. 6.6 Solving System of Linear Inequalities:. Solution of a System of Linear Equations: Any ordered pair that makes all the equations in a system true. Always Remember:. GOAL:. Y < x + 1.

E N D
System of Linear Inequalities: Two or more linear inequality equations. 6.6 Solving System of Linear Inequalities: Solution of a System of Linear Equations: Any ordered pair that makes all the equations in a system true.
Y< x + 1 < : Dashed line and shade below Y>x + 1 > : Dashed line and shade above
Y≤ x + 1 ≤ : Solid line and Shade below Y ≥ x + 1 ≥ : Solid line and shade above
Y< x + 1 Y≤ x + 1 Y>x + 1 Y ≥ x + 1
SOLVING A SYSTEM BY GRAPHING: To solve a system of inequalities we must: 1) Write the equations in slope-intercept form (y □mx+b) 2) Graph the equations and shade 3) Find an ordered pair point inside the shaded intersection region 4) Check
Ex:What is the solution of the system? Use a graph to check your answer. http://www.meta-calculator.com/online/
SOLUTION: 1) Write the equations in slope-intercept form (y□mx+b)
SOLUTION: 2) Graph the equations Dashed line and shade down Solid line and shade up
SOLUTION: 2) In the same graph:
SOLUTION: 3) Find the solution Looking at the graph, we see that any point in the double shaded region will be a solution, say: (0, 3)
SOLUTION: 4) Check We know that (0,3) is the solution from our graph.
YOU TRY IT:What is the solution of the system? Use a graph to check your answer.
SOLUTION: 1) Write the equations in slope-intercept form (y=mx+b)
SOLUTION: 2) Graph the equations Dashed line and shade down Dashed line and shade down
SOLUTION: 2) In the same graph:
SOLUTION: 3) Find the solution Looking at the graph, we see that any point in the double shaded region will be a solution, say: (2,-1)
SOLUTION: 4) Check We know that (2,-1) is the solution from our graph.
Real-World: You are planning what to do after school. You can spend at most 6 hrs. daily playing the trumpet and doing homework. You want to spend less than 2 hrs. playing the trumpet. You must spend at least 1.5 hrs. on homework. What is a graph showing how much you can spend your time?
Real-World(SOLUTION): You are planning what to do after school. You can spend at most 6 hrs. daily playing the trumpet and doing homework. You want to spend less than 2 hrs. playing the trumpet. You must spend at least 1.5 hrs. on homework. What is a graph showing how much you can spend your time? At most 6 hrs x + y ≤ 6 Less than 2 hrs trumpet x < 2 hrs At least 1.5 hrs homework y ≥1.5 hrs
SOLUTION: y ≤ - x + 6 x + y ≤ 6 10 9 8 7 6 5 4 3 2 1 4 5 6 1 2 3
SOLUTION: x < 2 10 9 8 7 6 5 4 3 2 1 4 5 6 1 2 3
SOLUTION: Y ≥1.5 10 9 8 7 6 5 4 3 2 1 4 5 6 1 2 3
All together in the same graph: SOLUTION: y ≤ - x + 6 10 9 x < 2 8 7 6 5 Y ≥1.5 4 3 2 1 4 5 6 1 2 3
SOLUTION: 10 9 y ≤ - x + 6 8 7 6 5 4 3 2 Y ≥1.5 1 4 5 6 1 2 3 x < 2 Any point in the red shaded area are solutions to the problem
YOU TRY IT: You have a job mowing the lawn for $10 per hour. You also have another job playing for parties and you charge $12 per hour. You need to earn at least $350 to buy a new instrument but you cannot work more than 35 hrs per week. You must work a minimum of 10 hrs playing at parties. What is a graph showing how many hours per week you can work at each job?
YOU TRY IT: (SOLUTION) Given info: X mowing the lawn y playing at parties earn at least $350 10x + 12y ≥ 350 x + y ≤ 35 no more than 35 hrs per week y ≥ 10 minimum of 10 hrs playing
SOLUTION: y ≥- x + 35 10x + 12y ≥ 350 60 50 40 30 20 10 10 6 20 30 40 50
SOLUTION: y ≤ - x + 35 x + y ≤ 35 60 50 40 30 20 10 10 6 20 30 40 50
SOLUTION: y ≥ 10 60 50 40 30 20 10 10 6 20 30 40 50
SOLUTION: All in one graph y ≥- x + 35 60 50 40 y ≤ - x + 35 30 20 y ≥ 10 10 10 6 20 30 40 50
SOLUTION: All in one graph 60 50 40 30 y ≤ - x + 35 20 y ≥- x + 35 y ≥ 10 10 10 6 20 30 40 50 Any point inside the red regionis a solution
VIDEOS: Graphing Inequalities https://www.khanacademy.org/math/algebra/linear-equations-and-inequalitie/graphing-linear-inequalities/v/graphing-inequalities https://www.khanacademy.org/math/algebra/linear-equations-and-inequalitie/graphing-linear-inequalities/v/solving-and-graphing-linear-inequalities-in-two-variables-1
CLASSWORK:Page 398-401 Problems: As many as needed to master the concept.