Download
1 / 16
160 likes | 257 Views
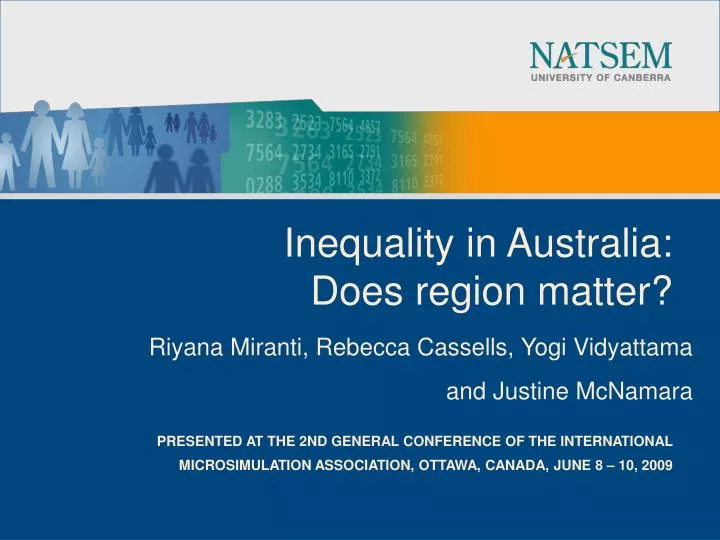
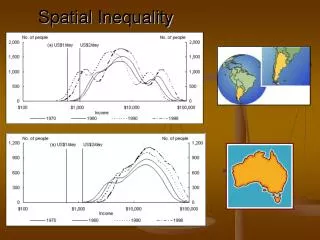
Inequality in Australia: Does region matter?. Riyana Miranti, Rebecca Cassells, Yogi Vidyattama and Justine McNamara. PRESENTED AT THE 2ND GENERAL CONFERENCE OF THE INTERNATIONAL MICROSIMULATION ASSOCIATION, OTTAWA, CANADA, JUNE 8 – 10, 2009. Measuring Inequality - Background.

E N D
Inequality in Australia: Does region matter? Riyana Miranti, Rebecca Cassells, Yogi Vidyattama and Justine McNamara PRESENTED AT THE 2ND GENERAL CONFERENCE OF THE INTERNATIONAL MICROSIMULATION ASSOCIATION, OTTAWA, CANADA, JUNE 8 – 10, 2009
Measuring Inequality - Background • Why we chose this topic ? • Objectives : • to provide valuable information about regional inequality at a small area level • to explore another use of spatial microsimulation and demonstrate its benefits
What are we going to do • Measuring inequality at small area using Gini coefficients • Reasons for use of Gini coefficients • Most common measure • Validation purpose – publicly available at the national and state level • Expand previous research with improvements : • disposable household income • smaller geographical unit than any that has been previously used • Using spatial microsimulation, as direct data are not available
Data source • Reweighting process uses three sources of data : • 2006 Census • Survey - SIH 2003-04 and 2005-06 • Validation use 2006 Census data, ABS published data and SIH 2005-06 • Limit the scope of study to New South Wales (NSW) and Victoria (Vic) • Unit of analysis : small area (Statistical Local Area)
Spatial methodology • Spatial microsimulation – SpatialMSM/09C • Small area weights for every SLA • Benchmarks variables • Complex process of spatial microsimulation
Gini coefficient • Has a value between zero and one • Zero means perfect equality, everyone has the same level of equivalised income • One means perfect inequality, one person holds all the income • Smaller Gini coefficient – more equal • Equivalised hh disposable income
Validation of our estimates • To see whether our Gini coefficient estimates are reliable • 197 SLAs in NSW, and 198 SLAs in VIC • Small area validation – equivalised gross household income data, see next slide • Aggregate data validation, at capital city and balance of state level – equivalised disposable household income data – overall looks good.
Validation – small area validation (NSW) The Spearman rank correlation is 0.958
Distribution of small area inequality estimates – New South Wales
Inequality and small area characteristics • Econometric analysis of determinants of inequality is beyond the scope of this paper. However : • Previous research in Australia discusses several factors associated with inequality • We find some similarities but also differences in characteristics among high inequality areas – no “One story fits all” • Need to look further into particular SLAs, which ones underlying difference
Conclusion • Application of spatial microsimulation • The validation shows that weights give reasonable results • Does region matter ? Yes. There are substantial variations in inequality at small area level • May help the policy makers/service providers to understand differences in order to better develop programs/policy. • Future work ? Econometric estimation, spatial microsimulation in order to model policy changes


![Climate Monitoring Products: Region V (Southwest Pacific) Dr. Andrew Watkins [Australia]](https://cdn2.slideserve.com/4682130/slide1-dt.jpg)