Download
1 / 10
100 likes | 259 Views
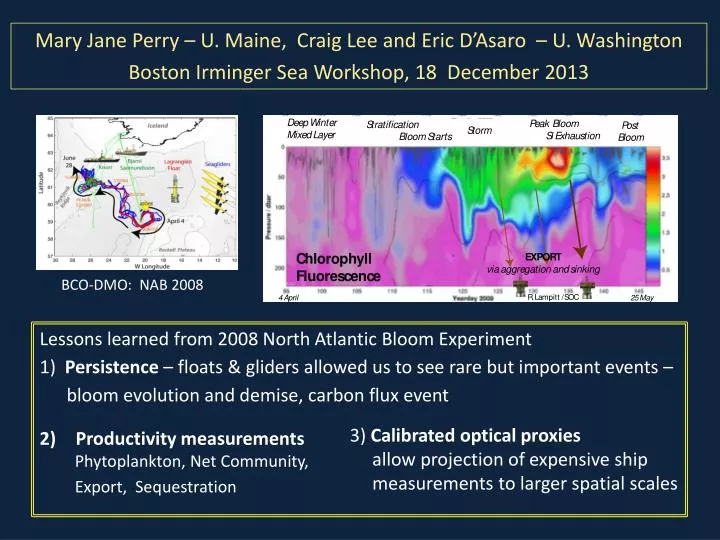
Mary Jane Perry – U. Maine, Craig Lee and Eric D’Asaro – U. Washington Boston Irminger Sea Workshop, 18 December 2013 . BCO-DMO: NAB 2008. Lessons learned from 2008 North Atlantic Bloom Experiment 1) Persistence – floats & gliders allowed us to see rare but important events –

E N D
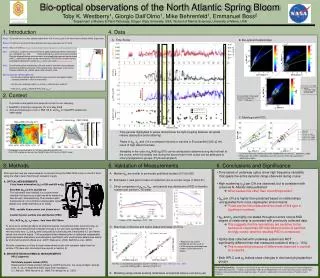
Mary Jane Perry – U. Maine, Craig Lee and Eric D’Asaro – U. Washington Boston Irminger Sea Workshop, 18 December 2013 BCO-DMO: NAB 2008 Lessons learned from 2008 North Atlantic Bloom Experiment 1) Persistence – floats & gliders allowed us to see rare but important events – bloom evolution and demise, carbon flux event Productivity measurements 3) Calibrated optical proxies allow projection of expensive ship measurements to larger spatial scales Phytoplankton, Net Community, Export, Sequestration
NAB 2008 Experimental Design: patch scale sampling, April-June • Persistence – measurements before, during, after bloom. Capture episodic events. • Float – Lagrangian frame (patch scale). • Seagliders – spatial context around drifting floats. • Big data – ~100 channels of nearly real-time data. • Proxy sensors –for carbon-cycle components; redundant sensors. • Ship-based sampling – calibration, inform interpretation. • Aggressive calibration efforts – lab, deployment, process & recovery. • Data & Cal Reports – data freely availablein NSF’s BCO-DMO data base. • Satellite remote sensing – ocean color, SST, Aviso SSH; NCEP winds. • Models – ecosystem, productivity, submesoscale circulation.
NAB 2008 Science Highlights Summary • Instabilities of the ML lateral density gradient initiate restratification, accelerate bloom onset by 20-30 days (than would occur with surface warming alone). Implications for phenology. • Patchiness inherent in ML eddy restratification. Patchiness maintained by eddy stirring & silicate limitation. Nonlinear biological interactions in patches. • Plankton community type (diatoms/pico-nanoplankton) also patchy. • Net community productivity changes with community type but net primary productivity changes less so. • Export efficiency depends on plankton community. • Community type can be mapped with Chl-F/bbp ratio; resolve spatial variations in export. • Aggregates of diatoms rapidly sink; diatom spores resist degradation.
NAB 2008 Technology Summary & Future Needs • Creative, multi-platform approaches can achieve results that would otherwise be impossible. • Analysis of BIG data requires big effort. • Mesozooplankton sensor is essential. • Calibration is critical but possible. Quantitative analyses (e.g. budgets) require in situ and cross-calibration of biogeochemical sensors; lab calibration is insufficient. Well-documented sensor reports (BCO-DMO). • Direct calibration does not scale to large numbers of platforms, highly distributed networks; requires engineered platform-platform encounters.
Before calibration to common reference Optical backscatter – pre-deployment calibrations were applied. • Before Calibration to Common Reference (backscatter) Before cross-calibration
After calibration to common reference After C\cross-calibration
1) Phytoplankton Productivity – P vs E Ship 14C P vs. E + float hourly Chl & PAR (also determined PP by diel cycle analysis) 2) Net Community Productivity – 2 moLagrangian float observations of NO3 drawdown and O2 evolution Daily PP 3) Export Productivity – = D NCP (O2 or NO3)– NCP (POC); export ratio = POC / NCP; ~30 - 70% 4) ~ Sequestration Productivity Event – sinking of diatom aggregates 0 –100 m integrated Carbon (mol C m-2)
Calibrated, validated optical proxies allow projection of expensive ship results to larger spatial scales scales. Optical community index: Chl F/bbp. Shift in species occurs when Si >1 µM. With the right sampling strategy, we can map micro and nano phytoplankton POC. Then apply community-specific export rate to produce time-resolved maps of carbon flux. But, we missed an important component ––zooplankton Export rate diatoms community ~ 12% / d Export rate for Microbial Loop ~ 3% / d
Proposed (and twice declined) follow on – NACycles Specific goalwas to measure and understand the upper ocean carbon budget in the subpolarNorth Atlantic over a complete annual cycle, at multiple spatial scales, and over multiple ‘trophic’ levels (nutrients, phytoplankton, zooplankton). We had good international collaboration and a well designed sampling strategy.
Understanding biogeochemistry and ecosystem biology requires observations at multiplescales – time scales, spatial scales, trophic levels Bottom Line –– understanding of details of small scale processes, coupled with basin scale observations, is critical to predicting biogeochemical and ecosystem responses to climate variability. Studying complete annual cycle is a good idea ! Some one is going to do it. Might have to chip away at parts of the cycle for now.