Download
1 / 18
190 likes | 421 Views
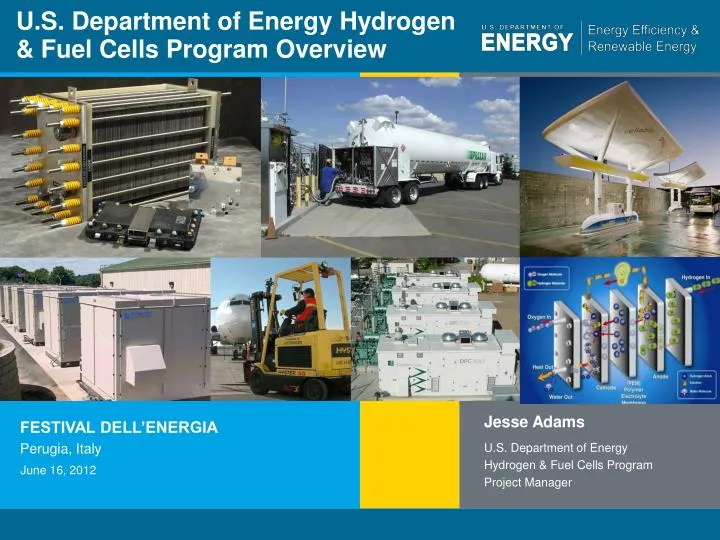
U.S. Department of Energy Hydrogen & Fuel Cells Program Overview. Jesse Adams. U.S. Department of Energy Hydrogen & Fuel Cells Program Project Manager. June 16, 2012. FESTIVAL DELL’ENERGIA Perugia, Italy. U.S. National Energy Strategy.

E N D
U.S. Department of Energy Hydrogen & Fuel Cells Program Overview Jesse Adams U.S. Department of Energy Hydrogen & Fuel Cells Program Project Manager June 16, 2012 FESTIVAL DELL’ENERGIA Perugia, Italy
U.S. National Energy Strategy “We’ve got to invest in a serious, sustained, all-of-the-above energy strategy that develops every resource available for the 21st century.” – President Barack Obama "Advancing hydrogen and fuel cell technology is an important part of the Energy Department's efforts to support the President's all-of-the-above energy strategy, helping to diversify America's energy sector and reduce our dependence on foreign oil." - Energy Secretary Steven Chu "Fuel cells are an important part of our energy portfolio and these deployments in early markets are helping to drive innovations in fuel cell technologies across multiple applications." - Dr. David Danielson Assistant Secretary for Energy Efficiency and Renewable Energy
U.S. Energy Consumption U.S. Primary Energy Consumption by Source and Sector Fuel Cells can apply to diverse sectors Share of Energy Consumed by Major Sectors of the Economy, 2010 Total U.S. Energy = 98 Quadrillion Btu/yr Source: Energy Information Administration, Annual Energy Review 2010, Table 1.3
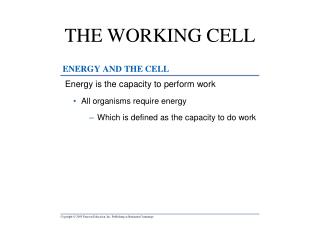
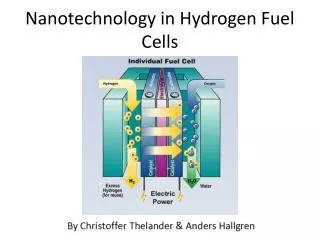
Background: Potential of Fuel Cell Technology Fuel cells convert chemical energy directly to electrical energy — with very high efficiency — and without criteria pollutant emissions. Combustion Engines — convert chemical energy into thermal energy and mechanical energy, and then into electrical energy. 15 – 40% efficiency Fuel cells — convert chemical energy directly into electrical energy, bypassing inefficiencies associated with thermal energy conversion. Available energy is equal to the Gibbs free energy. 60%+ efficiency possible Electrical Efficiency Fuel cells convert chemical energy directly into electrical energy, bypassing inefficiencies associated with thermal energy conversion Source: EPA, Catalog of CHP Technologies, December 2008
Well-to-Wheels CO2 Analysis Analysis by Argonne National Lab, DOE Vehicle Technologies Program, and FCT Program shows benefits from a portfolio of options H2 from Natural Gas Even FCEVs fueled by H2 from distributed NG can result in a >50% reduction in GHG emissions from today’s vehicles. Use of H2 from NG decouples carbon from energy use—i.e., it allows carbon to be managed at point of production vs at the tailpipe. Even greater emissions reductions are possible as hydrogen from renewables enter the market. Well-to-Wheels Greenhouse Gases Emissions Grams CO2-equivalent per mile Notes: For a projected state of technologies in 2035-2045. Ultra-low carbon renewable electricity includes wind, solar, etc. Does not include the lifecycle effects of vehicle manufacturing and infrastructure construction/decommissioning. Analysis & Assumptions at: http://hydrogen.energy.gov/pdfs/10001_well_to_wheels_gge_petroleum_use.pdf
Fuel Cells – An Emerging Global Industry Source: Clean Energy Patent Growth Index Clean Energy Patent Growth Index Top 10 companies: GM, Honda, Samsung, Toyota, UTC Power, Nissan, Ballard, Plug Power, Panasonic, Delphi Technologies Clean Energy Patent Growth Index[1] shows that fuel cell patents lead in the clean energy field with over 950 fuel cell patents issued in 2011. • Nearly double the second place holder, solar, which has ~540 patents. [1] http://cepgi.typepad.com/files/cepgi-4th-quarter-2011-1.pdf
Fuel Cell Market Overview System Shipments by Key Countries: 2008-2011 The fuel cell market remains strong with over 20,000 systems shipped in 2011, a > 35% increase over 20101 ~3X increase in VC/private equity fuel cell funding in just one year ($113M).* Global Hydrogen Production Market 2009 – 2016 (million metric tons) The global hydrogen market is also robust with over 55 Mtons produced in 2011 and over 70 Mtons projected in 2016, a > 30% increase. 1FCT Market Report to be published in June 2012. *by Top 10 Investors Sources: FuelCells2000, Pike Research, Markets & Markets
U.S. DOE Program Mission • The missionof the Hydrogen and Fuel Cells Program is to enable the widespread commercialization of hydrogen and fuel cell technologies through: • basic and applied research • technology development anddemonstration • Addressing institutional and market challenges • Key Goals: Develop hydrogen and fuel cell technologies for: • Early markets (e.g., stationary power, forklifts, portable power) • 2. Mid-term markets (e.g., residential CHP, auxiliary power, buses and fleet vehicles ) • 3. Longer-term markets, 2015-2020 (including mainstream transportation, with focus on passenger cars) An integrated strategic plan for the research, development, and demonstration activities of DOE’s Hydrogen and Fuel Cells Program http://hydrogen.energy.gov/roadmaps_vision.html
DOE Program Structure The Program is an integrated effort, structured to address all the key challenges and obstacles facing widespread commercialization. Nearly 300 projects currently funded at companies, national labs, and universities/institutes More than $1B DOE funds spent from FY 2007 to FY 2011
EERE H2 & Fuel Cells - Budget “The Committee recognizes the progress and achievements of the Fuel Cell Technologies program. The program has met or exceeded all benchmarks, and has made significant progress in decreasing costs and increasing efficiency and durability of fuel cell and hydrogen energy systems.”1 • ~$104 M in FY2012 for applied R&D • Basic Science R&D ~ $34M/year* • Fuel Cell Systems R&D • Hydrogen Fuel R&D • Technology Validation • Safety, Codes & Standards • Systems Analysis • Manufacturing R&D • Market Transformation Hydrogen Fuel R&D includes Hydrogen Production & Delivery R&D and Hydrogen Storage R&D *Funding through Basic Energy Sciences has been ~ $34M/year and FY12 will be determined based on number of relevant projects 1FY12 Appropriations Committee
DOE-Funded Progress - Highlights • Reduced projected high-volume cost of fuel cells to $49/kW (2011)* • Reduced Pt by a factor of 5 since 2005 • More than 30% reduction since 2008 • More than 80% reduction since 2002 • More than doubled the demonstrated durability (to 2,500 hours, or ~75,000 miles) of transportation fuel cells since 2006. • Reduced delivery cost by 40% since 2005 (tube trailers) • Demonstrated H2 tanks that can achieve >250 mile range (validated vehicle that can achieve 430 miles) • Identified and characterized more than 400 materials with potential for H2 storage • DOE-funded efforts enabled 33 commercial technologies in the market Current status: $49/kW vs target of $30/kW *Based on projection to high-volume manufacturing (500,000 units/year). The projected cost status is based on an analysis of state-of-the-art components that have been developed and demonstrated through the DOE Program at the laboratory scale. Additional efforts would be needed for integration of components into a complete automotive system that meets durability requirements in real-world conditions.
Hydrogen Production - Strategies Develop technologies to produce hydrogen from clean, domestic resources at a delivered and dispensed cost of $2-$4/gge H2 by 2020 Hydrogen Technical Advisory Committee Subcommittee: H2 Production Expert Panel Review underway to provide recommendations to DOE
Technology Validation • Completed world’s largest single FCEV & H2 Demonstration to date (50-50 DOE-Industry cost share) • >180 fuel cell vehicles and 25 hydrogen stations • 3.6 million miles traveled; 500,000 trips • ~152,000 kg of hydrogen produced or dispensed; >33,000 refuelings • Demonstrated world’s first Tri-generation station (100 kg/d) • Anaerobic digestion of municipal wastewater (Orange County Sanitation District) • Generates ~ 250 kW; 54% efficiency co-producing H2 and electricity • Nearly 1 million kWh of operation • >4,000 kg H2 produced • (Air Products, FuelCell Energy) • Demonstrated H2 for Energy Storage (NREL) • Showed PEM and alkaline electrolyzers provide grid frequency regulation, 4X faster than ‘control’ with no electrolyzers • Achieved 5,500 hrs of variable electrolyzer stack operation to determine effects of wind AC power on stack degradation *Independently validated a vehicle that can achieve a 430 mile range.
Market Transformation and ARRA – Catalyst for Deployments ARRA and MT deployments of fuel cells for lift trucks led to industry purchases* of an estimated 3,000 additional fuel cell lift trucks with NO DOE funding Fuel Cell Deployments Fuel Cell Lift Truck Purchases • Exceeded ARRA target of up to 1,000 fuel cell deployments • Demonstrated 1 million hours of operation to date * Including deployed and on order
Global Collaboration Opportunities- New Database & Data Collection Durability data for various fuel cell applications compiled by NREL – includes global companies Collecting data from companies to benchmark progress. No proprietary information or company attribution. Only ‘composite’ and average data is provided. Please email Fuelcelldatacenter@ee.doe.gov Continue collaboration on critical safety, codes and standards activities Launched open source database on Hydrogen Storage Materials Properties: http://hydrogenmaterialssearch.govtools.us/ Launched study on H2 resource availability Coordination with IEA HIA Task 30 and IPHE Need analyst contacts from various countries.
Future Directions Continue and strengthen critical R&D Hydrogen, fuel cells, safety, codes and standards, etc. Conduct strategic, selective demonstrations of innovative technologies Continue to conduct key analysis to guide RD&D and path forward, determine infrastructure needs Leverage activities to maximize impact Continue and strengthen communication and outreach
Acknowledgements Federal Agencies • Industry Partnerships & Stakeholder Assn’s. • Tech Teams (U.S. DRIVE) • Fuel Cell and Hydrogen Energy Association (FCHEA) • Hydrogen Utility Group • ~ 65 projects with 50 companies • External Input • Annual Merit Review & Peer Evaluation • H2 & Fuel Cell Technical Advisory Committee • National Academies, GAO, etc. • DOC • DOD • DOE • DOT • EPA • GSA • DOI • DHS • NASA • NSF • USDA • USPS • Interagency coordination through staff-level Interagency Working Group (meets monthly) • Assistant Secretary-level Interagency Task Force mandated by EPACT 2005. DOE Hydrogen & Fuel Cells Program • State & Regional Partnerships • California Fuel Cell Partnership • California Stationary Fuel Cell Collaborative • SC H2 & Fuel Cell Alliance • Upper Midwest Hydrogen Initiative • Ohio Fuel Coalition • Connecticut Center for Advanced Technology Universities ~ 50 projects with 40 universities • International • IEA Implementing agreements – 25 countries • International Partnership for Hydrogen & Fuel Cells in the Economy – 17 countries & EC National Laboratories National Renewable Energy Laboratory P&D, S, FC, A, SC&S, TV, MN Argonne A, FC, P&D, SC&S Los Alamos S, FC, SC&S Lawrence Livermore P&D, S, SC&S Savannah River S, P&D Brookhaven S, FC Idaho National Lab P&D Sandia P&D, S, SC&S Pacific Northwest P&D, S, FC, SC&S, A Oak Ridge P&D, S, FC, A, SC&S Lawrence Berkeley FC, A Other Federal Labs: Jet Propulsion Lab, National Institute of Standards & Technology, National Energy Technology Lab (NETL) P&D = Production & Delivery; S = Storage; FC = Fuel Cells; A = Analysis; SC&S = Safety, Codes & Standards; TV = Technology Validation, MN = Manufacturing
Thank you Jesse Adams Project Manager Jesse.Adams@go.doe.gov Sunita Satyapal Program Manager Sunita.Satyapal@ee.doe.gov Hydrogen and Fuel Cells Program U.S. Department of Energy Additional Information www.hydrogen.energy.gov