Download
1 / 14
160 likes | 392 Views
Energetics of Marine Ecosystems Part II. Section 3. Review. primary source of energy for photosynthetic organisms is the sun/light . Food web Food chain Biomass. Gross Primary Production (GPP).

E N D
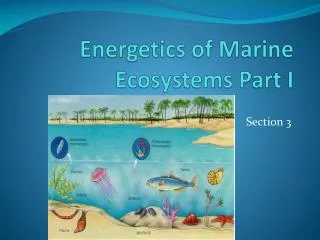
Energetics of Marine Ecosystems Part II Section 3
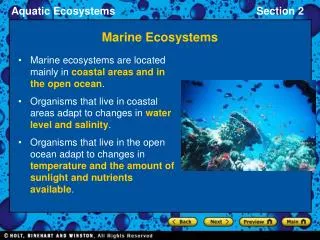
Review • primary source of energy for photosynthetic organisms is the sun/light. • Food web • Food chain • Biomass
Gross Primary Production (GPP) • calculate the % of incident light energy which appears as energy of newly synthesised organic substances • The total energy captured by primary producers = GPP • respiration (R) • Net primary production (NPP) - Remaining organic substances • Transferred to higher trophic levels • NPP = GPP – R • ~10% energy available at one trophic level is transferred to the next trophic level
Energy Losses Along Food Chains • 3 reasons: • Respiration/heat • Waste/feces • Excretion (feces) or egestion (from cells) • Some parts of organism not eaten • Of total energy from Sun, only a small percentage is captured and used for synthesis (NOT ALL ENERGY BECOMES AVAILABLE AS NET PRODUCTION) • Reflected back from surfaces • Pass straight through a producer – not absorbed • Inefficiencies of photosynthesis • NPP = GPP – R
BIG reason why RARELY have more than 5 levels • Energy losses between trophic levels • “loss of heat energy” • Insufficient energy available to transfer to more than 5 trophic levels
Efficiency of Energy transfer between trophic levels • Net productivity of plants in a food chain is 36,000 kJ/m2 per year • Net production of herbivores is 1,700 kJ/m2 per year • Efficiency of transfer of energy from the producers to herbivores (1,700 / 36,000) x 100 = 4.72% • Energy losses: heat from respiration, losses in urine, undigested plant material (fecal matter) • Energy of production of herbivores represent total energy available to carnivores (next trophic level)
Example • 3.5% • Show work! [1 point]
Productivity can be measured as mass of carbon incorporated into biological molecules per unit area per unit time • The primary productivity of the phytoplankton in this food web is 90 g of carbon per m2 per year. • The efficiency of transfer between phytoplankton and herbivores is approximately 10%. • Assuming that zooplankton and bottom-feeding herbivores eat equal quantities of phytoplankton, calculate the amount of carbon incorporated into zooplankton per m2 per year. Show your working. • ....................................................... g C m–2 year–1 [2] • Answer: 90/10% = 9/2 = 4.5
Ecological Pyramids • Graphical representation of food chain • Producers at base • Horizontal bars represents successive trophic levels • Width of bar proportionalto numbers, biomass or energy • Impossible to have more energy in higher trophic levels
Example • Draw a pyramid of biomass for the following food chain: Phytoplankon krill fish penguins killer whales [2] Answer: • pyramid with 5 levels; • each level named; (trophic)
4th, 5th, 6th, 7th 4th, 5th, 6th 4th, 5th, 6th 3rd, 4th 4th, 5th, 6th 3rd, 4th, 5th 3rd, 4th , 5th 3rd, 4th, 5th 2nd, 3rd 2nd 1st trophic level
4th, 5th 3rd, 4th, 5th 3rd, 4th 3rd 3rd 2nd 2nd 3rd, 4th 1st trophic level