Download
1 / 12
120 likes | 271 Views
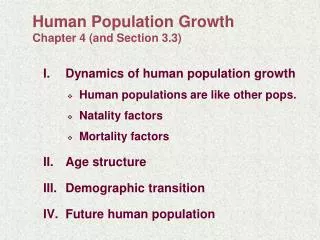
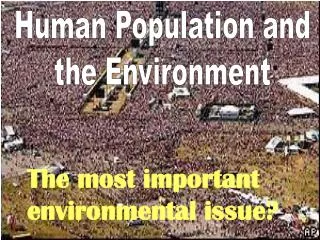
Chapter 4—The Human Population and the Environment. Disclaimer: The views expressed in this chapter are not necessarily those of Mrs. Hernandez and/or Marian High School. The “Haves” and the “Have-Nots”. The United Nations (UN) classifies all countries into 3 categories:

E N D
Chapter 4—The Human Population and the Environment Disclaimer: The views expressed in this chapter are not necessarily those of Mrs. Hernandez and/or Marian High School
The “Haves” and the “Have-Nots” The United Nations (UN) classifies all countries into 3 categories: High income, highly developed Middle income, moderately developed Low income, developing Examples of each???? The Haves (highly developed countries): 16% of global pop., control 81% of wealth The Have-Nots (low-income, developing countries) 41% of world pop., 3.4% of wealth
United Nations Development Program (UNDP), Human Poverty Index (HPI): Criteria: • Lifespan: probability of living to age 40 • Knowledge: literacy of adults in pop. • Standard of living: • % pop. without a decent, clean water supply • % underweight kids under 5 yrs.
Pop. Growth from Haves and Have-Nots: • Haves: 0.1% growth rate; add less than 1 million people to world pop. per year • Have-Nots: 1.6% growth rate; add more than 76 million people per year (98% of the total human pop. growth) Reasons: • Higher fertility rate; greater than 2.0 where 2.0 is replacement level (aver is 3.1 but can be as high as 5.0) • partially due to more infant and child mortalities.
I = P x A x T Calculating human pressure on environment (I): • P = population • A = affluence (wealth) • T = technology Translation: a small population can have a huge impact on the environment; we (“haves”) are guilty of abusing the environment, perhaps more so than the huge pop. of “have-nots”.
Walk lightly • Human justice and rights • Nutrition, education, health, employment, safety (from crime, natural disasters), leadership, help from the more fortunate • Stewardship • Environmental I = P x A x T S (S = concern and practice) • http://www.youtube.com/watch?v=rvTFKpIaQhM
Assignment: Summarize: “A Closer Look 4.2: The Prophecy of Malthus” on p. 68 Explain how each component of the I = P x A x T formula has an impact. Bring calculator tomorrow.