Download
1 / 28
280 likes | 422 Views
Low Head / Low Power Resource Assessment of Hydrologic Units 11 and 17. Randy D. Lee. December 18, 2002. Hydro Power Background. 1989 DOE initiated a National Energy Strategy Identify energy resources for expanding demand Major differences in estimates from FERC and COE

E N D
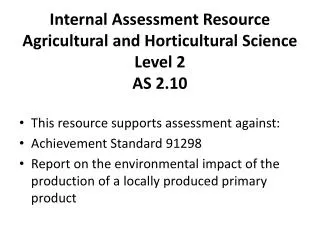
Low Head / Low Power Resource Assessment of Hydrologic Units 11 and 17 Randy D. Lee December 18, 2002
Hydro Power Background • 1989 DOE initiated a National Energy Strategy • Identify energy resources for expanding demand • Major differences in estimates from FERC and COE • 70,000 MW – 600,000 MW • No previous estimates of undeveloped power • 1998 Interagency Hydropower Resource Assessment Team established • Assessment addressed resources of 1 MW or greater • 2000 DOE initiated an assessment of U.S. hydropower resources of less than 1 MW • Low head (less than 30 feet) • Low power (less than 1 MW)
Project Objective • Develop and demonstrate a method for estimating the hydropower potential for a large geographic area • USGS – provided flow, elevation, and power estimates by stream reach • INEEL – analyzed, assessed and reported on potential hydropower resources
Synthetic Stream Networks • Provided by USGS - developed from the Elevation Derivatives for National Applications (EDNA) Dataset • Stream channels derived from digital elevation models (DEMs) • Stream reaches are generally defined as segments between confluences (average reach length 2 mi.) • EDNA associates local runoff surface area (catchment) with each stream reach (average catchment area 3 mi.2) • Total drainage area supplying runoff to reach outlet obtained by summing area of upstream catchments
Total Drainage Area: 24.67 mi2 Synthetic Stream Networks (Continued)
Stream Reach Flow Estimation • EDNA catchments were overlaid with climate data from the Oregon State University PRISM Dataset • Mean annual precipitation • Mean annual temperature • Stream flow regression equation from: Vogel, Wilson, and Daly (1999), “Regional Regression Models of Annual Streamflow for the United States”: Journal of Irrigation and Drainage Engineering, May/June 1999, p. 148-157
Stream Reach Flow Estimation (Continued) Stream Flow Regression Equation Arkansas White Red Region Q11 = e-18.627A0.96494P3.8152T-1.9665 where • Q is the mean flow for a site in Region 11 (A-W-R), in cubic meters per second • A is drainage area, in square kilometers • P is mean annual precipitation, in mm/yr • T is mean annual temperature, in degrees Fahrenheit times 10
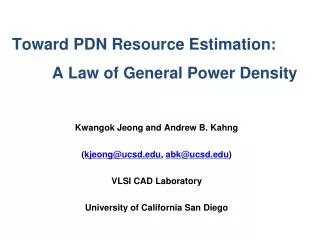
Hydropower Potential Estimation Hydropower Potential Equation P = [Qi * H + (Qo-Qi) * H/2] = H(Qi+Qo)/2 where • P = power in kilowatts • = (1/11.8) • Qi= flow rate at the upstream end of the stream reach in cubic feet per second • Qo = flow rate at the downstream end of the stream reach in cubic feet per second • H = hydraulic head in feet equal to zi - zo • zi = elevation at the upstream end of the stream reach in feet • zo = elevation at the downstream end of the stream reach in feet
Identification of Excluded Waterways • Intersect synthetic streams with excluded waterways • Wild & Scenic Rivers and National Parkways • Federally protected linear features • Federal and Tribal Lands • National battlefields • National parks • National parkways • National monuments • National preserves • Wildlife preserves • Wildlife management areas • Wilderness areas
Synthetic Streams NHD Streams Validation of Synthetic Stream Networks • EDNA synthetic stream dataset intersected with National Hydrography Dataset (NHD) to identify false streams Red River Drainage
NON-EXCLUDED Stream Reach Hydropower Potential Dataset Excluded Waterways Filter Stream Reach Hydropower Potential Dataset (without false synthetic streams) EXCLUDED Stream Reach Hydropower Potential Dataset Power Summation • Sum stream reach power potentials for: • All reaches • Excluded reaches • Non-excluded reaches
32,430 MW 1,966 MW Total Developed Hydropower Capacity • Total developed hydropower capacity in the region was obtained from: Hydroelectric Power Resources of the United States - Developed and Undeveloped, Washington: Federal Energy Regulatory Commission, 1 January 1992, p. 80. • Total developed hydropower capacity for each region: Region-11 Region-17
Total Hydropower Potentials – HUC-11 Megawatts Total Hydropower Potential All stream reach potentials Total Excluded Hydropower Potential All excluded stream reach potentials Total Non-excluded Hydropower Potential All non-excluded stream reach potentials Total Available Hydropower Potential Total non-excluded - Developed 5,024 = 130 = 4,894 = 2,928 = 4,894 1,966 “Available” means Non-excluded, Undeveloped
Total Hydropower Potential Results Region-11Region-17 Total hydropower potential 5,024 MW 76,425 MW Total excluded hydropower potential 130 MW 20,294 MW Total non-excluded hydropower potential 4,894 MW 56,131 MW Total developed hydropower capacity 1,966 MW32,430 MW Total available hydropower potential 2,928 MW 23,710 MW
Total Hydropower Potential Results (Continued) Region-17 Region-11 Total Hydropower Potential 76,425 MW Total Hydropower Potential 5,042 MW
The Low Head/Low Power Regime Microhydro Power
NON-EXCLUDED Stream Reach Hydropower Potential Dataset Excluded Waterways Filter Stream Reach Hydropower Potential Dataset (without false synthetic streams) EXCLUDED Stream Reach Hydropower Potential Dataset LH/LP Technical Approach • Filter stream reach hydropower potential dataset using low head/low power regime boundaries:
LH/LP Hydropower Potential Results Region-11 Total LH/LP hydropower potential 2,021 MW Total excluded LH/LP hydropower potential 53 MW Total non-excluded LH/LP hydropower potential 1,968 MW Total developed LH/LP hydropower capacity 0 MW Total available LH/LP hydropower potential 1,968 MW Region-17 Total LH/LP hydropower potential 1,992 MW Total excluded LH/LP hydropower potential 203MW Total non-excluded LH/LP hydropower potential 1,789 MW Total developed LH/LP hydropower capacity 5 MW Total available LH/LP hydropower potential 1,784 MW
Power Potential Results – Region 11 Zero Power Low Head / Low Power High Head / Low Power High Power
Zero Power Low Head / Low Power High Head / Low Power High Power Excluded Area Power Potential Results – Region 17
Conclusions • This project has demonstrated a viable technical approach to assessing regional hydropower potential • Replication of the technical approach for the remaining 16 hydrologic regions can produce similar results for the entire continental US • There is a significant available hydropower potential in the two Hydrologic Regions studied ( 2,000 MW in Region 11 and 24,000 MW in Region 17) • Two-thirds of the available hydropower potential in the Region 11 is low head/low power • Nearly 2,000 MW of the available hydropower potential in the Region 17 falls in the category of LH/LP