Download
1 / 15
150 likes | 167 Views
WARM AND COLD WAVES AND PRECIPITATION VARIABILITY ON TERRITORY BiH IN LAST TEN YEARS COMPARATIVE WITH ROW 1961-1990 ŽELJKO M AJSTOROVIC , D Ženan Zulum , Ismira Ahmović, Ibrahim Hadžismajlović, Federal Meteorological Institute B&H, Sarajevo. Consequence of climate changes:

E N D
WARM AND COLD WAVES AND PRECIPITATION VARIABILITY ON TERRITORY BiH IN LAST TEN YEARS COMPARATIVE WITH ROW 1961-1990 ŽELJKO MAJSTOROVIC, DŽenan Zulum, Ismira Ahmović, Ibrahim Hadžismajlović, Federal Meteorological Institute B&H, Sarajevo.
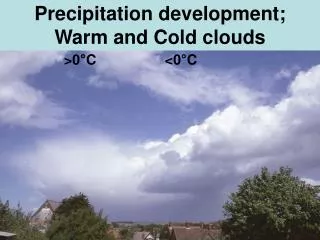
Consequence of climate changes: - Increasing global average temperature last hundred years for about 0,7o C - Increasingvariability of weather and number of natural catastrophe as a resoult of meteorologycal opportunity
Introduction Last decade (1996-2005) was warmest in last 50 yearson the territory B&H. The research this phenomena, we were using folowing stations data: Station φ λ Hs Mostar 43 21 17 48 99 Sanski Most 44 46 16 42 158 Sarajevo 43 52 1826 630 Bjelasnica 43 42 18 16 2067
However researches with monthly and decade values hadn't give adequate results, because extremly warm and extremely cold periods are of short duration. So, we desided to do our researches by pentade´s values (periods of five days) and compare it with adequate values in respective order 1961-1990 year.
SARAJEVO 2000 ANUUAL CHANGE AVERAGE PENTADE TEMPERATURE 26,0 21,0 16,0 11,0 oC 6,0 1,0 -4,0 1 5 9 13 17 21 25 29 33 37 41 45 49 53 57 61 65 69 73 -9,0 -14,0 Pentade t+2*sd t+sd t (average 61-90) t-sd t-2*sd 2000 • Figure 1 show average pentad temperature oscillations in Sarajevo Figure 1
Figure 2 shows anomalies of average pentad temperature oscillations on Sarajevo station applied to a decade: Figure2
Similar oscillations were detected at precipitation. (Fig 3). We can see two extreme pentad sum in Sarajevo: 169.5 mm (4th pentad December 1999) and 138.7 mm (5th October 2003).
Temperature Table 1. Number of pentads with average temperatures > t+sd or t-sd MOSTAR SANSKI MOST SARAJEVO BJELASNICA To determine intensity and number of these oscillations we applied these conditions: t+sd, t+2*sd, t-sd, t-2*sd, and we analyzed 720 values of pentad temperature from row 1996. – 2005. Tables 1 and 2 shows result. In table 1 we can see that number of evidenced extreme pentad is highest in Mostar, and lowest on Bjelasnica. Worm 202,0 181,0 187,0 100,0 Cold 83,0 93,0 101,0 78,0
MOSTAR SANSKI MOST SARAJEVO BJELASNICA Absolute max. 43,0 34,0 46,0 40,0 Absolute min. 10,0 21,0 20,0 12,0 Number of pentads with record temperatures is also equaled. We can spot difference in number of absolute maximums and absolute minimums; witch is to be expected considering the fact that last decade (1996. – 2005) was very warm. Number of absoluteminimums is still relatively high and it is pointing to great temperature oscillations and great changes of the wader in last decade Table 2. Number of pentads with temperatures > abs. max or abs. min
Precipitation • Number of rain pentad is unequaled for observed stations; it is approximately equal in Sanski Most and Sarajevo, while in Mostar and Bjelašnica. • Number of strongly rain pentad is equaled for all observed stations except Bjelašnica with higher number. It is same case for the number of extreme rain pentad. This number is also relatively high, and it indicates changes in precipitation regime. • Dry periods were not analyzed here;
Table 3. Number of pentads with precipitation > R+sd or R+2*sd or max. precip. MOSTAR SANSKI MOST SARAJEVO BJELASNICA Rainy 97,0 126,0 124,0 73,0 Very rainy 49,0 52,0 52,0 72,0 Extreme rainy 25,0 25,0 28,0 40,0
Conclusion • We are determined a large number, of pentads with extreme values using parameters. However because of trends global worming the number of warm periods are increasing also is evident large number of cold periods what indicating on huge oscillations of temperatures. • Analyses of precipitations indicate large number of pentads sum with extreme values. Processing pentad values we determined presence. We indicated cold and worm waves and large variability regime of precipitations. • Observed phenomena are in harmony with world’s processes of global warming.